


Latest website statistics will help you understand how websites are growing and changing in 2026.
With these insights, you can identify emerging trends, understand user behavior, and make better decisions for your website.
In this guide, we have gathered 90+ verified statistics covering traffic, performance, mobile usage, security, ecommerce, and more.
Let’s take a closer look.
Key Website Statistics for 2026
- Around 1.49 billion websites exist worldwide.
- Around 639,769 new websites are created every day.
- 71% of small businesses have a website
- Mobile drives 51.51% of global web traffic.
- Google Chrome holds 69.65% of the browser market.
- Google dominates search with a 91.27% market share.
- WordPress powers 41.2% of all websites.
- WooCommerce powers 8.2% of all websites.
- Average website bounce rate is 45.28%.
- HTTPS protects 90.1% of websites.
Website Size, Revenue and Growth Statistics
1. There are nearly 1.5 billion sites on the web.
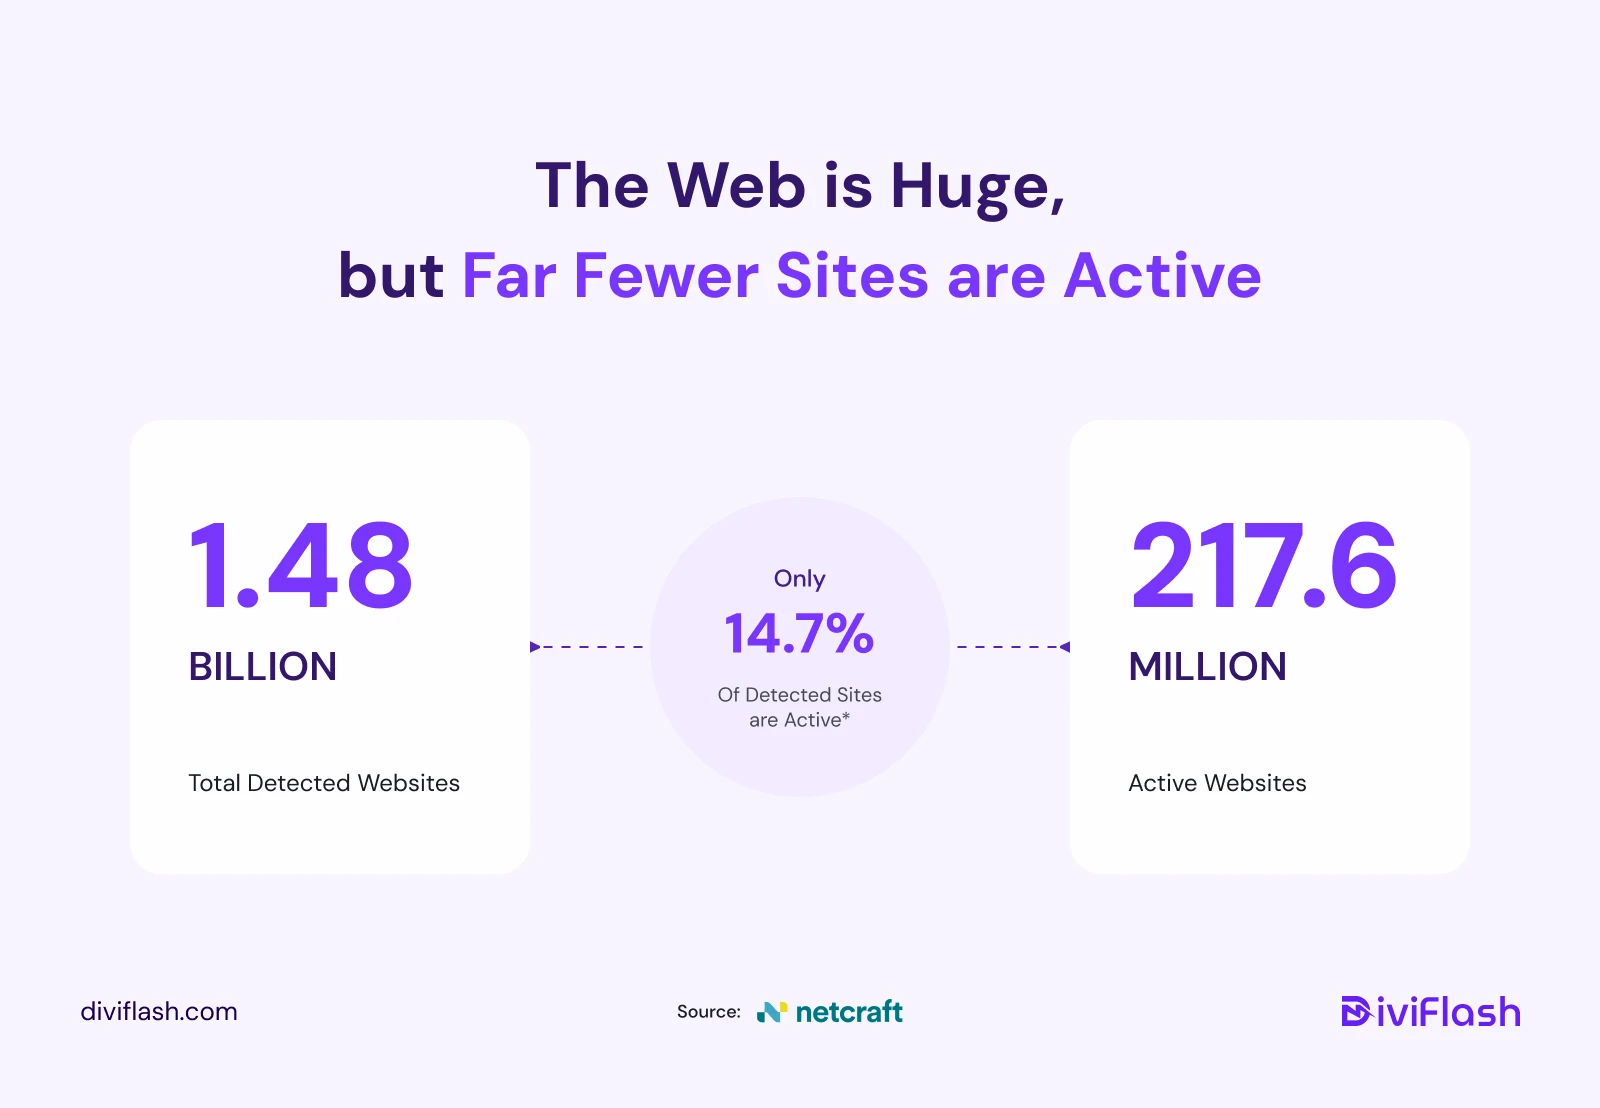
Netcraft detected 1.48 billion sites in June 2026, including hostnames and sites that share the same infrastructure. (Netcraft)
2. The internet has more than 304 million registered domains.
The web contained 304.1 million domains, with each domain able to host multiple websites or subdomains. (Netcraft)
3. Over 14.6 million computers power the web.
Around 14.65 million web-facing computers were serving websites, and each one can host many sites. (Netcraft)
4. The web gained 2 million more domains in a month.
The number of registered domains increased by 2 million, reflecting steady growth across the internet. (Netcraft)
5. The web added over 81,000 new servers.
Netcraft detected 81,854 more web-facing computers in June 2026 to support growing web traffic and services. (Netcraft)
6. About one in six websites uses Cloudflare.
Cloudflare’s infrastructure served 16.2% of all detected sites in Netcraft’s June 2026 survey. (Netcraft)
7. Cloudflare saw the biggest monthly increase.
Its network grew by 4.1 million sites, the largest increase among the providers tracked that month. (Netcraft)
8. Google’s infrastructure also grew significantly.
Netcraft detected 2.7 million more sites using Google’s infrastructure, the second-largest monthly increase. (Netcraft)
Website Traffic Analysis and Visitor Statistics
Traffic data helps explain where visitors come from and how they interact with a website or webpage. Common traffic sources include direct visits, referrals, social media, and organic and paid traffic.
Here are some of the common stats:
9. Google is the world’s most visited website.
Google maintained the number-one position in Similarweb’s worldwide website ranking. (Similarweb)
10. About 21% of business owners report low website traffic as a challenge
Low traffic remains a common obstacle to attracting customers and growing online sales. (Forbes Advisor)
11. YouTube is the second-most visited website worldwide.
Its ranking reflects the continued popularity of video content, education, and entertainment. (Similarweb)
12. Facebook ranks as the third-most visited website.
It remains the highest-ranked social networking platform in Similarweb’s global rankings. (Similarweb)
13. Visitors spend an average of 52 to 54 seconds on a webpage
Time on page varies based on content, traffic source, and user intent. (AgencyAnalytics)
14. Instagram is the fourth-most visited website.
The platform continues to attract significant web traffic alongside its mobile app audience. (Similarweb)
15. ChatGPT is the fifth-most visited website worldwide.
It was the only AI chatbot platform to reach the global top five. (Similarweb)
16. Google users spend an average of 10 minutes and 5 seconds per visit.
This reflects the average time visitors stay on the website during a session.(Similarweb)
17. Google has a bounce rate of 28.35%.
About three in ten visitors leave after viewing only one page. (Similarweb)
18. YouTube users spend an average of 18 minutes and 55 seconds per visit.
It had the longest average visit time among the top five websites. (Similarweb)
19. ChatGPT visitors spent over six minutes per visit.
Users viewed nearly four pages on average during each visit. (Similarweb)
Website Traffic by Device
Comparing device-level traffic metrics can reveal broader traffic trends and show whether mobile, desktop, or tablet users dominate a site’s audience.

20. Mobile devices generate 51.51% of global web page views
Mobile accounts for the largest share of worldwide web traffic across all device types. (StatCounter)
21. Desktop computers generate 47.12% of global web page views
Desktop devices still account for nearly half of all web page views worldwide. (StatCounter)
22. Tablets account for 1.36% of global web page views
Tablet devices contribute only a small share of worldwide web traffic. (StatCounter)
Website Performance and Speed Statistics
23. The average Speed Index of the world’s 100 most visited websites was 8.28 seconds in 2026
Speed Index measures how quickly the visible content of a page appears during loading. (Reboot Online)
24. Google has the fastest Speed Index among the top 100 websites at 1.20 seconds
Its First Contentful Paint is 0.91 seconds, while its Largest Contentful Paint reaches 1.08 seconds. (Reboot Online)
25. The 10 fastest websites have an average Speed Index of 2.36 seconds
The list includes Google, DeepSeek, IMDb, FedEx, Wikipedia, Facebook, Yandex, Adobe, and two other websites. (Reboot Online)
26. Facebook records a Speed Index of 2.95 seconds
Its First Contentful Paint is 2.95 seconds, while its Largest Contentful Paint reaches 3.25 seconds. (Reboot Online)
27. YouTube has a Speed Index of 6.21 seconds
Its First Contentful Paint is 6.21 seconds, while its Largest Contentful Paint reaches 8.74 seconds. (Reboot Online)
28. Patreon has the slowest Speed Index among the top 100 websites at 45.01 seconds
Its Largest Contentful Paint reaches 62.12 seconds in the Lighthouse-based analysis. (Reboot Online)
29. Google’s Speed Index is more than 37 times faster than Patreon’s
Google loads in 1.20 seconds, compared with 45.01 seconds for Patreon. (Reboot Online)
Website User Experience Statistics
30. UX Friction Affects 35.2% of Sessions
More than one-third of website visits include frustration signals such as slow loading, repeated clicks, excessive hovering, or technical errors. (Contentsquare)
31. Slow Loads Affect 10.9% of Sessions
Slow page loads continue to impact about one in ten visits, despite improving year over year. (Contentsquare)
32. Rage Clicks Increased by 1.5%
More visitors repeatedly click or tap unresponsive elements, signaling growing user frustration. (Contentsquare)
33. Desktop Visitors Scroll Further
The average scroll depth reaches 50.5% on desktop, compared with 45.2% on mobile devices. (Contentsquare)
34. Desktop Converts 75% Better
The average desktop conversion rate was 3.4%, compared with 2% on mobile. (Contentsquare)
34. 61% of Product Page Visits Bounce
Most visitors who land on a product page leave without visiting another page. (Contentsquare)
35. Only 13% Return Within 30 Days
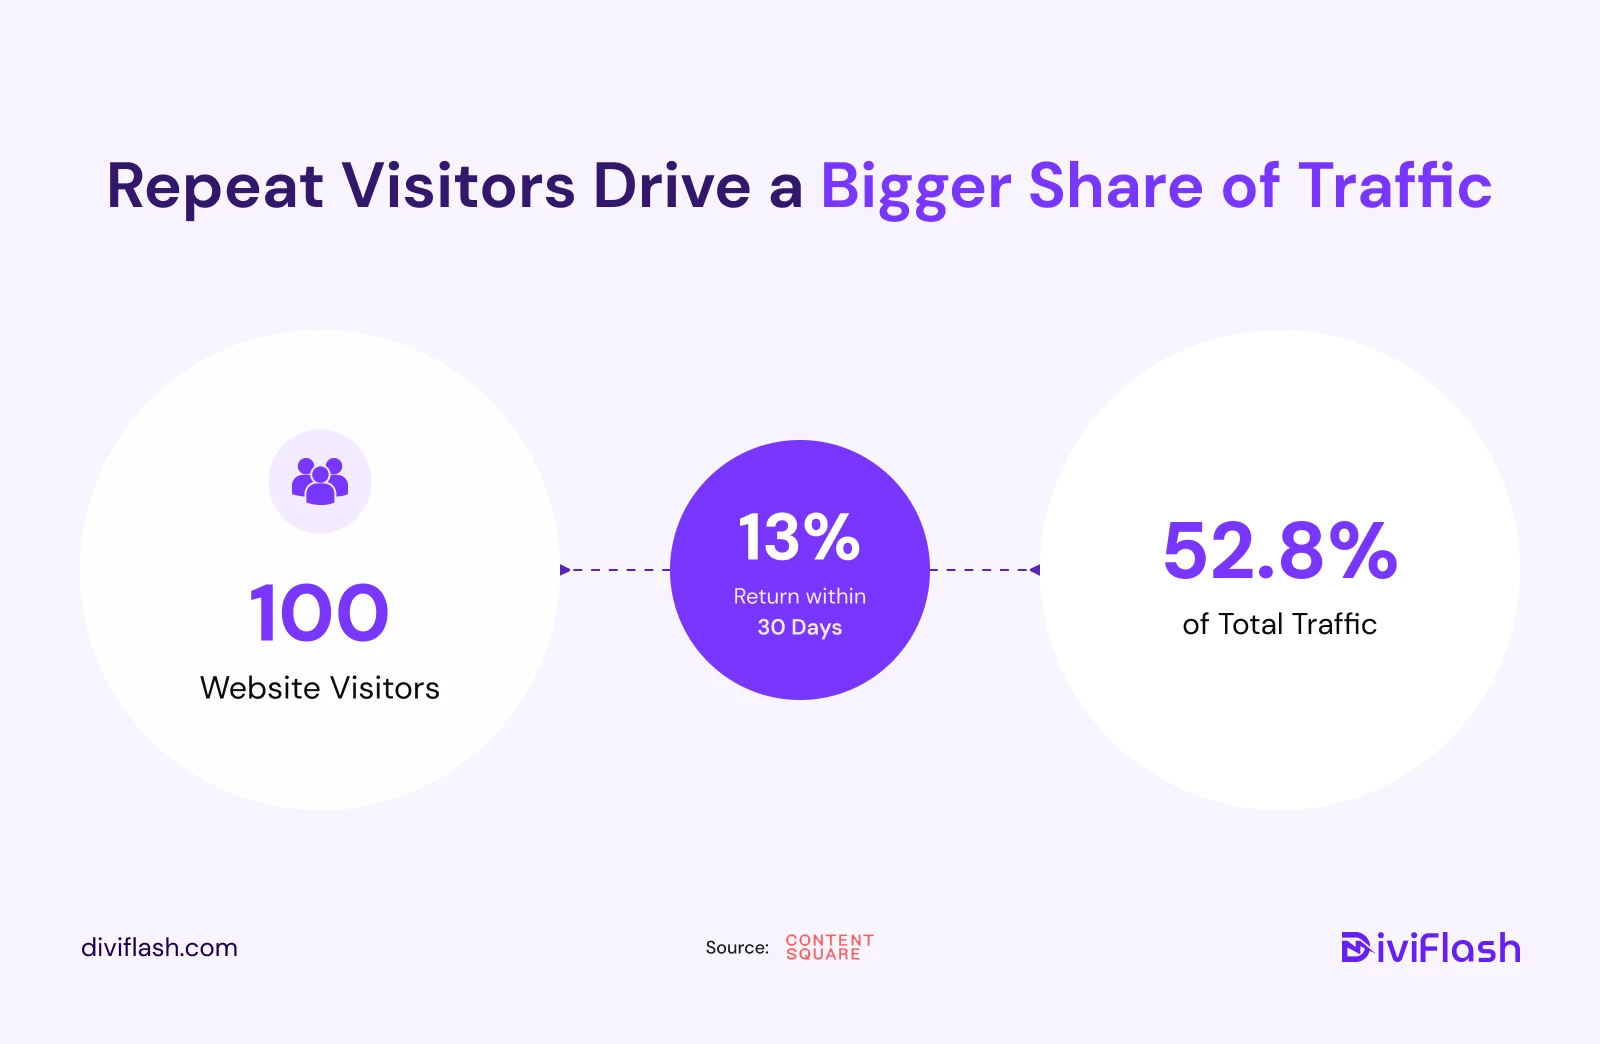
Most websites struggle to bring visitors back within a month of their first visit. (Contentsquare)
36. Returning Visitors Drive 52.8% of Traffic
Although relatively few users return, repeat visitors account for more than half of total traffic. (Contentsquare)
Website Engagement and Conversion Statistics
37. Ecommerce Sites Convert at 2.74%
The global ecommerce conversion rate reached 2.74%, with rates varying by region, device, and product category. (Dynamic Yield)
38. 94% of website trust issues are related to design
About 94% of negative feedback focuses on design, while only 6% relates to content. (CXL)
39. Beauty Sites Convert at 5.37%
Beauty and personal care websites recorded a 5.37% conversion rate, while luxury and jewelry averaged 0.71%. (Dynamic Yield)
40. Conversion Rates Fell by 5.1%
Conversion rates fell by 5.1% year over year across 99 billion sessions and more than 6,500 websites. (Contentsquare)
41. Website Engagement Dropped by 10%
Time on site fell by 7%, page views by 1%, and scroll depth by 2%. (Contentsquare)
42. Only 13% Return Within 30 Days
Despite the 13% return rate, repeat visitors generated a large share of traffic and conversions. (Contentsquare)
43. More page elements can reduce conversions by 95%

Increasing mobile page elements from 400 to 6,000 can reduce the predicted conversion rate by 95%. (Think with Google)
44. Pages with videos keep visitors engaged longer
Visitors spend an average of 6 minutes on pages with videos, compared with 4.3 minutes on pages without them. (Wistia)
45. A one-second faster load time can increase conversions by 27%
Improving page load speed by one second can boost website conversions by up to 27%. (Liquid Web)
Website Design Statistics
46. 83% of users prefer modern website designs
More than eight in ten users value an attractive and up-to-date website design. (Clutch)
47. 94% of users value easy website navigation
Nearly all users consider clear and easy navigation an essential website feature. (Clutch)
48. 49% of consumers leave websites with confusing navigation
Nearly half of users abandon websites that are difficult to navigate. (Clutch)
49. 67% of Mobile Ecommerce Sites Have Poor Navigation UX
Baymard found that 67% of mobile sites have mediocre-to-poor navigation, compared with 58% of desktop sites. (Baymard Institute)
50. 22% of ecommerce websites show an inadequate product range
More than one in five ecommerce websites fail to showcase enough products on their homepage. (Baymard Institute)
51. It takes an average of three months to design a website
A website with basic features typically takes about three months to design and launch. (Forbes Advisor)
52. The average web designer earns $63,842 per year
Web designers earn an average annual salary of $63,842. (Zippia)
Website Security and Downtime Statistics
53. 90.1% of websites use HTTPS by default
Around 90.1% of websites automatically redirect visitors to secure HTTPS connections. (W3Techs)
54. 93.6% of the top one million websites use HTTPS
HTTPS adoption reaches 93.6% among the world’s most visited websites. (W3Techs)
55. 94% of login attempts come from bots
Automated bots generate 94% of login attempts across Cloudflare’s network. (Cloudflare)
56. 63% of login attempts use compromised credentials
Nearly two-thirds of login attempts involve credentials exposed in previous data breaches. (Cloudflare)
57. DDoS attacks reach 31.4 Tbps
Cloudflare recorded DDoS attacks with traffic peaks of 31.4 terabits per second. (Cloudflare)
58. 28% of WordPress vulnerabilities remain unpatched
More than one in four published WordPress vulnerabilities have no security patch available. (Patchstack)
59. Plugins cause 85% of WordPress vulnerabilities
Plugins account for 85% of WordPress vulnerabilities, while themes account for 15%. (Patchstack)
60. 25% of WordPress vulnerabilities require immediate action
One in four vulnerabilities is classified as high priority, while 10% are rated critical. (Patchstack)
61. 43.1% want better vulnerability scanning
The same percentage of Sucuri survey respondents also want improved security analytics and reporting. (Sucuri)
62. 1 in 10 outages has a serious impact
About 10% of organizations report serious or severe consequences from their latest outage. (Uptime Institute)
63. Outage rates decline for the fifth consecutive year
Website and infrastructure outages continue to decrease, although the pace of improvement has slowed. (Uptime Institute)
Ecommerce Website Statistics
64. BuiltWith detects 24.9 million ecommerce websites
BuiltWith identifies 24.9 million websites using ecommerce technologies worldwide. (BuiltWith)
65. The US has 13.77 million ecommerce website detections
The United States has the largest number of ecommerce technology detections in BuiltWith’s database. (BuiltWith)
66. 16.9% of websites use an ecommerce system
About 16.9% of websites use a detectable ecommerce platform, while 83.1% do not. (W3Techs)
67. WooCommerce holds 48.4% of the ecommerce market
WooCommerce powers 8.2% of all websites and 48.4% of websites using an ecommerce system. (W3Techs)
68. Shopify holds 31.2% of the ecommerce market
Shopify powers 5.3% of all websites and 31.2% of websites using an ecommerce system. (W3Techs)
Website Programming and Framework Statistics
69. PHP powers 70.6% of websites with a known server-side language
PHP remains the most widely used server-side programming language. (W3Techs)
70. JavaScript is used on 98.8% of websites
Nearly all websites use JavaScript for interactive features and functionality. (W3Techs)
71. jQuery is used by 67.3% of websites
It remains the most widely used JavaScript library, with an 86.9% library market share. (W3Techs)
72. Bootstrap is used by 15.3% of websites
Bootstrap holds a 19.8% share among websites using a recognized JavaScript library. (W3Techs)
73. React is used by 6.1% of websites
React accounts for 7.8% of websites with an identifiable JavaScript library. (W3Techs)
74. Python powers 1.2% of websites with a known server-side language
Its usage is higher among top-ranking websites than across the web overall. (W3Techs)
Web Server Statistics
75. Nginx powers 31.5% of websites with a known web server
Nginx remains the most widely used web server, ahead of Cloudflare Server and Apache. (W3Techs)
76. Cloudflare Server is detected on 29% of websites
Cloudflare Server ranks second among websites with an identifiable web server. (W3Techs)
77. Apache powers 23.1% of websites with a known web server
Apache remains one of the most widely used web servers despite newer alternatives. (W3Techs)
78. LiteSpeed powers 15.1% of websites with a known web server
LiteSpeed ranks fourth and continues to be a popular choice for high-performance websites. (W3Techs)
Web Hosting Statistics
79. Shopify hosts 5.3% of all websites
Shopify is the most widely used hosting provider, followed by Hostinger and Amazon. (W3Techs)
80. Hostinger hosts 5.1% of all websites
Hostinger ranks second among hosting providers, with its market share increasing from 4.6% to 5.1%. (W3Techs)
81. Amazon hosts 4.5% of all websites
Amazon ranks third by website count and remains a leading cloud hosting provider. (W3Techs)
Note: For more data on hosting’s market growth, infrastructure and more, explore our web hosting statistics blog.
Website Accessibility Statistics
82. 95.9% of home pages have WCAG accessibility errors
Only 4.1% of tested home pages were free of automatically detected WCAG failures. (WebAIM)
83. The average home page has 56.1 accessibility errors
WebAIM found an average of 56.1 accessibility issues across one million home pages. (WebAIM)
84. 83.9% of home pages have low-contrast text
Low color contrast remains the most common accessibility issue on websites. (WebAIM)
85. 53.1% of home pages have missing alternative text
More than half of home pages contain images without descriptive alt text. (WebAIM)
86. 51% of home pages have missing form labels
Over half of tested home pages include forms without accessible labels. (WebAIM)
Website SEO and Optimization Statistics
Google search is a major source of search traffic. Organic traffic comes from unpaid search results, while PPC campaigns and search ads generate paid traffic. Keyword rankings and AI Overviews can also influence how much traffic a website receives.
87. Google holds 91.31% of the global search engine market
Google leads with 91.31% of searches, while Bing holds 4.47% and Yahoo 1.24%. (StatCounter)
88. 53% of mobile websites pass all Core Web Vitals
About 53% of mobile websites achieve good scores for LCP, INP, and CLS. (HTTP Archive)
89. 65% of mobile websites achieve a good LCP score
Around 65% of mobile websites load their main content within Google’s recommended threshold. (HTTP Archive)
90. Open Graph is used by 71.6% of websites
Open Graph helps social platforms display page titles, images, and descriptions when links are shared. (W3Techs)
91. 20.6% of websites use no structured data
About one in five websites use none of the structured-data formats tracked by W3Techs. (W3Techs)
FAQ
How Many Websites Are There in 2026?
Netcraft detected approximately 1.49 billion sites across 304.1 million domains in June 2026. This total includes subdomains, hostnames, and sites sharing the same infrastructure.
How Many Websites Are Active?
Netcraft’s June 2026 data indicates that approximately 217.6 million websites were active.
How Many New Websites Are Created Each Day?
There is no authoritative count of newly created websites per day. However, Netcraft recorded a net increase of 21.1 million sites in June 2026, equal to roughly 703,000 additional detected sites per day.
What Is the World’s Most Visited Website?
Google.com was the world’s most visited website in June 2026, followed by YouTube.
What Percentage of Website Traffic Is Mobile?
Mobile devices generated 51.51% of worldwide web page views in June 2026. Desktop accounted for 47.12%, while tablets generated 1.36%.
What Is the Most Popular CMS?
WordPress is the most popular CMS, powering 41.2% of all websites and holding 59.1% of the known CMS market.
What Is the Most Popular Web Browser?
Google Chrome is the most popular browser, holding 69.65% of the worldwide browser market in June 2026.
How Many Websites Use HTTPS?
HTTPS is the default protocol on 90.1% of all websites, meaning around nine in ten websites automatically use an encrypted connection.
How Does a Website Traffic Checker Work?
A website traffic checker estimates monthly traffic, traffic sources, top keywords, and competitor traffic. Google Analytics and Google Search Console provide data for your own website, while Semrush and Ahrefs offer third-party traffic estimates.
Conclusion
That’s a wrap on our latest website statistics.
You can use these insights to understand current website trends, improve performance, and make better decisions for your online presence.
Want more statistics like this? Stay tuned and follow our blog!
FAQ
How Many Websites Are There in 2026?
Netcraft detected approximately 1.49 billion sites across 304.1 million domains in June 2026. This total includes subdomains, hostnames, and sites sharing the same infrastructure.
How Many Websites Are Active?
Netcraft’s June 2026 data indicates that approximately 217.6 million websites were active.
How Many New Websites Are Created Each Day?
There is no authoritative count of newly created websites per day. However, Netcraft recorded a net increase of 21.1 million sites in June 2026, equal to roughly 703,000 additional detected sites per day.
What Is the World’s Most Visited Website?
Google.com was the world’s most visited website in June 2026, followed by YouTube.
What Percentage of Website Traffic Is Mobile?
Mobile devices generated 51.51% of worldwide web page views in June 2026. Desktop accounted for 47.12%, while tablets generated 1.36%.
What Is the Most Popular CMS?
WordPress is the most popular CMS, powering 41.2% of all websites and holding 59.1% of the known CMS market.
What Is the Most Popular Web Browser?
Google Chrome is the most popular browser, holding 69.65% of the worldwide browser market in June 2026.
How Many Websites Use HTTPS?
HTTPS is the default protocol on 90.1% of all websites, meaning around nine in ten websites automatically use an encrypted connection.
How Does a Website Traffic Checker Work?
A website traffic checker estimates monthly traffic, traffic sources, top keywords, and competitor traffic. Google Analytics and Google Search Console provide data for your own website, while Semrush and Ahrefs offer third-party traffic estimates.
Conclusion
That’s a wrap on our latest website statistics.
You can use these insights to understand current website trends, improve performance, and make better decisions for your online presence.
Want more statistics like this? Stay tuned and follow our blog!


0 Comments