

E-commerce has transformed the way people shop, offering convenience, variety, and accessibility like never before. With online shopping continuing to grow rapidly, businesses must understand key e-commerce statistics to stay competitive in this dynamic landscape.
From mobile-driven sales trends to the increasing role of social commerce, data provides valuable insights into consumer behavior and market shifts.
In this article, we explore the latest e-commerce statistics that highlights trends and opportunities shaping the future of online retail.
Key Ecommerce Statistics
Ecommerce accounted for a significant 20.1% of global retail sales in 2024. (eMarketer)
On 2021, it accounted for 18.8% and by 2027 it is expected to be at 22.6%.
Amazon is the world’s largest e-commerce giant, valued at $1.34 trillion. (Statista)
Alibaba comes in second place with a valuation of $214 billion. Amazon captured 40.4% of US retail ecommerce sales in 2024, totaling $491.65 billion. To put it in perspective, Walmart’s retail ecommerce sales amounted to $83.18 billion in 2024.
Amazon is also the most popular e-commerce website in the US by monthly traffic (2.08 billion) followed by eBay (543.8 million) and Walmart (492.7 million).
Grocery will top US online sales by 2026. (eMarketer)
By 2026, groceries are expected to lead U.S. e-commerce sales, reaching 19% of all e-commerce sales. Grocery e-commerce shopping growth will outpace other popular categories like electronics and apparel.
Nearly three out of four online shoppers don’t complete their purchases. (Baymard)
Around 70% of online shoppers leave items in their carts without checking out. The main reason consumers abandon their carts is unexpected costs like shipping and taxes, followed by the need to create an account. This suggests that simplifying the checkout process and offering transparent pricing could help businesses reduce cart abandonment.
US ecommerce revenue will grow by $475B over the next four years. (Statista)
The expected $475 billion growth in U.S. eCommerce revenue over the next four years shows how rapidly online shopping is expanding. As more consumers shift to digital shopping, businesses will need to innovate and adapt to meet the growing demand.
Ecommerce Consumer Behavior Statistics
The average order size for online purchases is 4.95 items. (Statista)
On average, people buy about five items every time they place an online order. That means most shoppers tend to purchase multiple things at once, rather than just a single item.
Free delivery is the primary motivator for 45% of online shoppers. (Data Reportal)
For 45% of online shoppers, free delivery is the main reason they decide to make a purchase. This shows how important shipping costs are in influencing buying decisions.
Consumers are most receptive of ads in e-commerce sites.(Integral Ad Science)
36% of consumers would like to see ads on e-commerce sites closely followed by news sites and social media (35%).
Adults aged 18 to 24 make up the largest demographic group of ecommerce shoppers in the United States. (Statista)
The fact that adults aged 18 to 24 are the largest group of eCommerce shoppers shows how important it is for businesses to target younger audiences with digital marketing strategies. As this group becomes more tech-savvy and accustomed to online shopping, their buying habits will likely shape the future of eCommerce.
56.1% of internet users aged 16-64 shop online on a weekly basis. (Data Reportal)
The fact that the majority of internet users of all ages worldwide, make an online purchase every week shows how ingrained online shopping has become in daily life.
In 2023, the average online shopper spent a substantial $1,109 annually. (Data Reportal)
In the U.S., the average consumer spends $2,700 each year, more than twice the global average.
Lower prices, convenience, and free shipping are the primary drivers of online shopping, accounting for 64% of consumer choices. (Feedvisor)
According to a research of Feedvisor, the top five reasons consumers shop online are lower prices (29%), convenience (21%), free shipping (14%), product availability (7%), and good customer service (7%).
Social Media Ecommerce Statistics
China is the social commerce capital of the world. (Statista)
Although it may sound surprising, but China has the most social media users in the world, almost 300 million more than India, which comes at second place. In 2023, China had $471 billion USD in social commerce GMV.
Gen Z, Millennials, and Gen X prefer social media for product discovery. (HubSpot)
According to HubSpot, 64% of Gen Z, 59% of Millennials, and 47% of Gen X uses social media to discover new products.
Nearly half of social media users are comfortable with social commerce. (HubSpot)
In 2023, 47% of all social media users felt comfortable shopping online through social media. Also, 42% of them trust social media platforms with their card information.
Nearly seven out of ten social media marketers use the platform to send potential customers to their websites. (HubSpot)
68% of social media marketers use social media platforms to direct people to their websites.
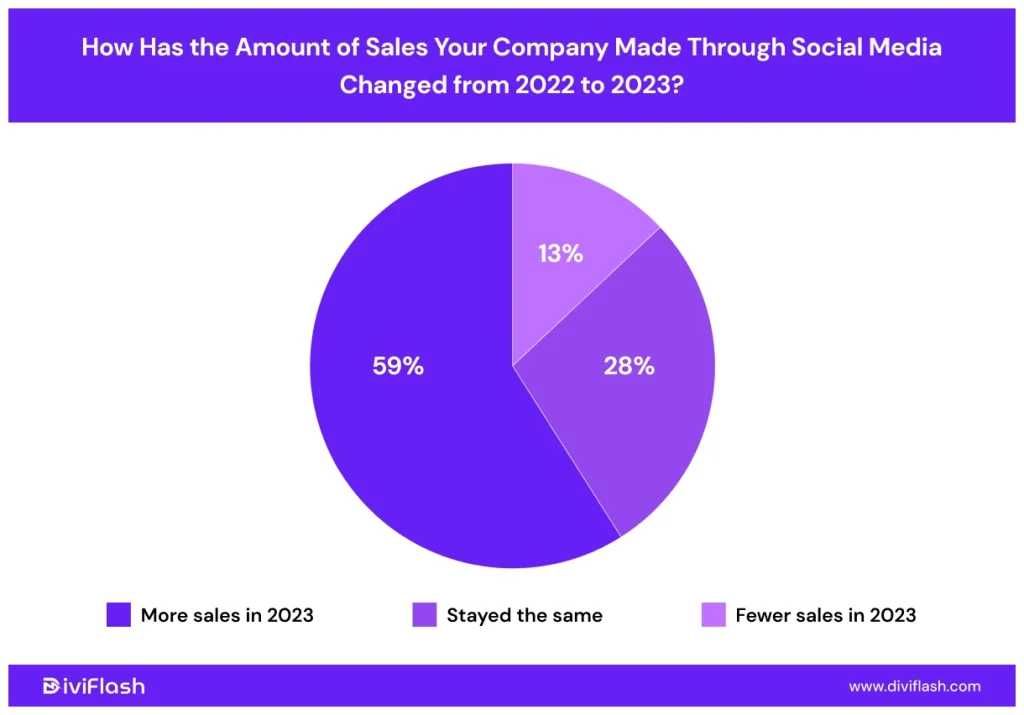
Almost six out of ten sellers are selling more products with social media. (HubSpot)
In 2023, 59% of companies saw an increase in sales through social media, 28% saw no change, and 13% experienced a decline.
The biggest concern for consumers when buying directly on social media is whether the sellers are legitimate. (HubSpot)
That’s where brand authority comes into play. If you can establish your company as a brand in social media platforms and search engines, you’ll likely t get more sales.
50% of marketers will invest more in social commerce in 2024. (HubSpot)
In 2024, one in two marketers plan to invest more in social commerce. This shows that they see growing potential in selling products directly through social media platforms.
Facebook, Instagram, and YouTube are the most used platforms for social selling among marketers. (HubSpot)
Among these platforms, Facebook and YouTube offers the highest ROI.
Facebook is the most popular and the most trusted social media platform for in-app purchases. (HubSpot)
On the other hand, TikTok is least trusted social media platform.
Most social media marketers expect more social commerce in 2024. (HubSpot)
84% of social media marketers believe social commerce will grow in 2024. This suggests that more brands will focus on selling products directly through social media platforms.
82% of consumers expressed satisfaction with their recent social shopping experience. (HubSpot)
Most consumers are happy with their recent social shopping experiences. This shows that shopping directly on social media platforms is becoming a popular and positive experience for many buyers.
Mobile Ecommerce Statistics
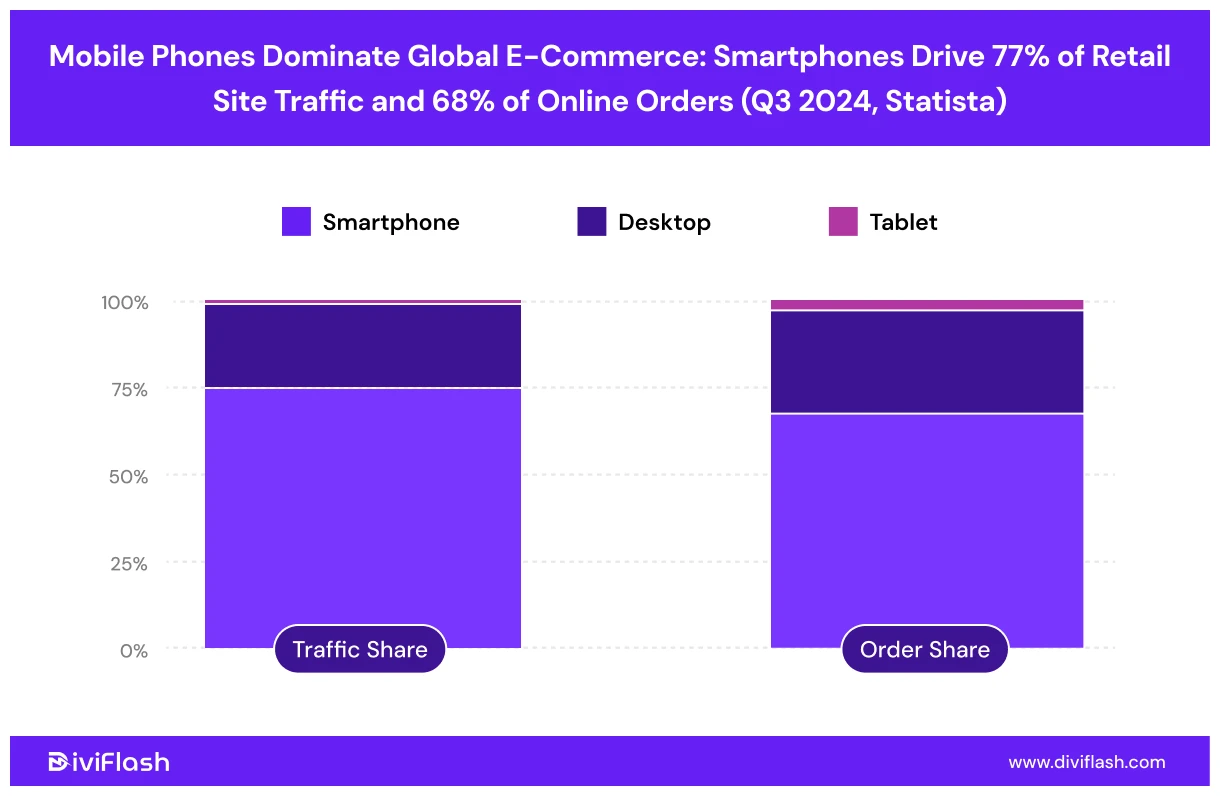
66% of online orders are placed via smartphones. (Statista)
With 66% of online orders being placed via smartphones, it’s clear that mobile commerce is driving the future of eCommerce. Businesses need to prioritize mobile-friendly websites and apps to meet consumer demand for quick, convenient shopping on the go.
U.S. mobile retail ecommerce sales will top $450 billion in 2024. (Statista)
The expected $450 billion in U.S. mobile retail eCommerce sales in 2024 highlights the growing dominance of smartphones in shaping shopping habits. For businesses, this emphasizes the need to optimize mobile shopping experiences, from fast-loading pages to easy payment options, to capitalize on this massive shift toward mobile-first shopping.
Apple Pay is the most widely used mobile payment format by U.S. consumers. (Statista)
Apple Pay’s position as the most widely used mobile payment method in the U.S. reflects the growing preference for quick, secure, and contactless payment options. For businesses, offering Apple Pay as a payment option can enhance convenience and help attract customers who prioritize seamless transactions.
Mobile commerce is set to dominate 42.9% of e-commerce sales in 2024. (eMarketer)
It’s clear that smartphones are becoming the primary tool for online shopping. Businesses must invest in mobile-optimized websites and apps to meet the demands of consumers who want to shop quickly and easily from their devices.
In the US, an estimated 161.6 million individuals utilize mobile wallets, representing 64.9% of the total smartphone user base. (eMarketer)
With the majority of US consumers using mobile wallets it’s clear that mobile payments are becoming a mainstream choice. This shift highlights the growing demand for quick, secure, and convenient payment methods.
Mobile devices drove 73% of ecommerce site traffic in April 2024. (Dynamic Yield)
Mobile devices driving most of the e-commerce site traffic underscores how essential mobile optimization is for online businesses. To succeed, companies must focus on creating fast, user-friendly mobile experiences to capture and retain the majority of their audience.
B2B Ecommerce Statistics
Most B2B sales will be digital by 2025. (Gartner)
By 2025, 80% of B2B sales interactions are expected to happen through digital channels. Businesses are increasingly moving away from traditional sales methods and embracing online platforms for transactions.
79% of B2B buyers prefer online reorders. (Sana Commerce)
The fact that most B2B buyers prefer online reorders shows the growing demand for convenience and efficiency in business transactions. Simplifying the reorder process online helps companies save time and ensures a smoother purchasing experience
The main concern of B2B buyers is lack of information on delivery times when it comes to shopping online.(Sana Commerce)
B2B buyers’ main concern when shopping online is the lack of information about delivery times. This highlights the importance of clear and reliable shipping details for businesses, as timely delivery is a critical factor in their purchasing decisions.
15% of B2B buyers are willing to make online purchases exceeding $1 million. (McKinsey)
Also, more that 30% of B2B buyers are comfortable with spending more than $500,000 on online shopping.
B2C Ecommerce Statistics

Global B2C ecommerce revenue will reach $5.5 trillion by 2027. (International Trade Administration)
The projected $5.5 trillion in global B2C eCommerce revenue by 2027 reflects the growing reliance on online shopping worldwide. For businesses, this means greater opportunities, but also increased competition.
Consumer electronics, fashion, and furniture dominate the B2C e-commerce landscape. (International Trade Administration)
As consumers increasingly turn to online shopping for big-ticket items like furniture or the latest gadgets, brands in these sectors will need to offer personalized experiences to capture and retain customer attention.
Retail ecommerce sales are forecast to surpass eight trillion dollars by the year 2027. (Statista)
As online shopping continues to grow, businesses will have to adjust to keep up. The rise in e-commerce shows that more people are choosing to shop online, making it an important area for companies to focus on.
Retail media ad spend will hit $140B this year, accounting for 20.3% of digital ad spend. (eMarketer)
The significant rise in retail media ad spending reflects how much brands are focusing on reaching consumers at the point of purchase. As more people shop online, advertising directly on retail platforms offers a powerful way to influence buying decisions.
Final Thoughts
E-commerce is constantly evolving, and staying informed about the latest trends and statistics is key to thriving in this competitive space. By understanding customer behavior, leveraging mobile and social commerce, and optimizing online experiences, you can find new opportunities for growth and success in the ever-expanding world of digital retail.


0 Comments