

Divi does not include a built-in module or setting for creating line charts. Therefore, you will need a plugin like DiviFlash, which includes a dedicated Line Chart module.
This one lets you enter data manually or import it from Google Sheets, CSV, and JSON sources. It also allows you to customize datasets, axes, legends, tooltips, line styles, and more.
Together, these features let you create line chart in Divi with ease. We are going to walk you through the complete process in six steps.
Let’s get started.
Our Created Line Chart
To show you the creation process of the Line Chart in Divi, we will create the following design.

Note: We will only cover the Line chart creation process. You can download the complete design for free from DiviFlash’s Line Chart demo page.
Required Setup
Before starting, make sure the following are ready:
- Latest version of Divi (Divi 5) is installed and activated.
- Latest version of DiviFlash (5.2.0) is installed and activated.
Once these are ready, let’s start building.
Step 1: Add Line Chart Module
Open the page where you want to display the line chart and click Enable Visual Builder. After that:
- Add a Section, Row, and Column
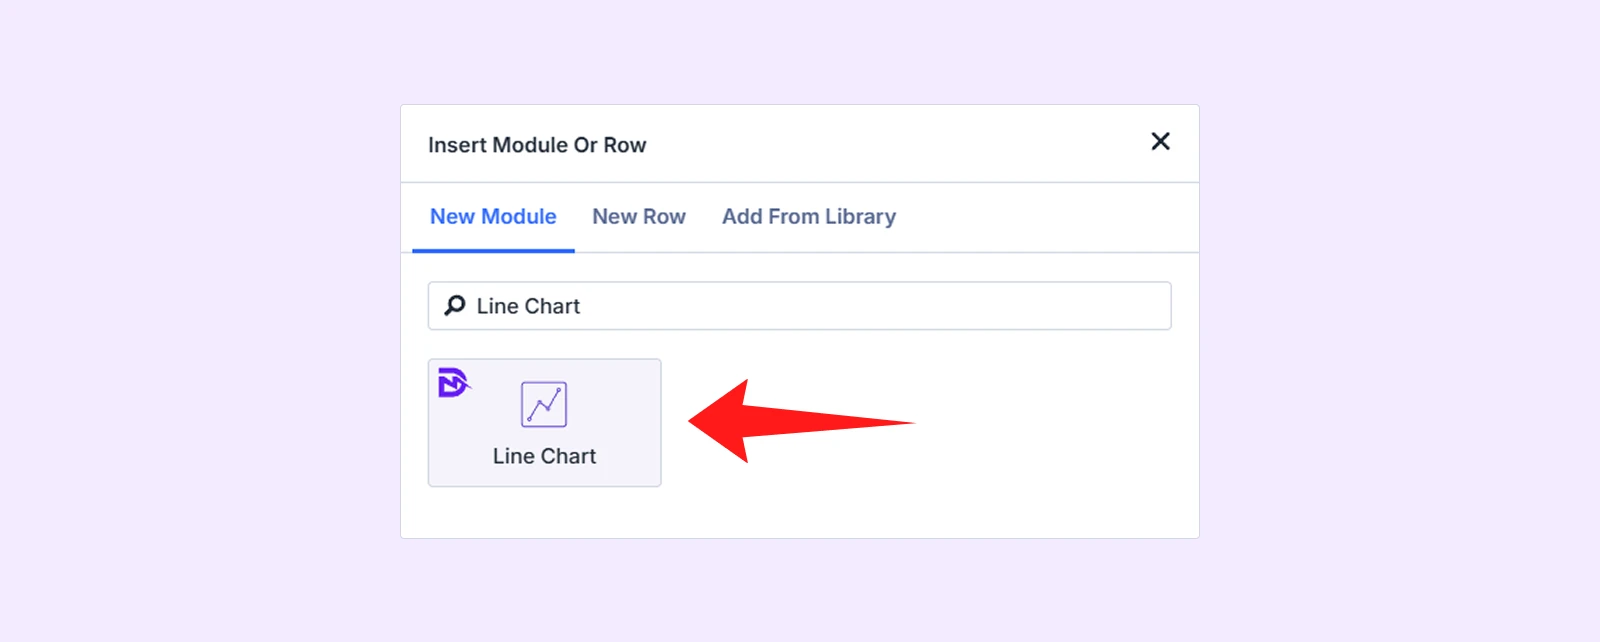
- Click the + icon
- Search for Line Chart
- Insert the module
Note: If you cannot find the module, go to WordPress Dashboard > DiviFlash > Modules and toggle on Line Chart.
Step 2: Add the Line Dataset Values
After inserting the module, you will see two default datasets. Here is what to do:
- Delete one of them to match our demo design.
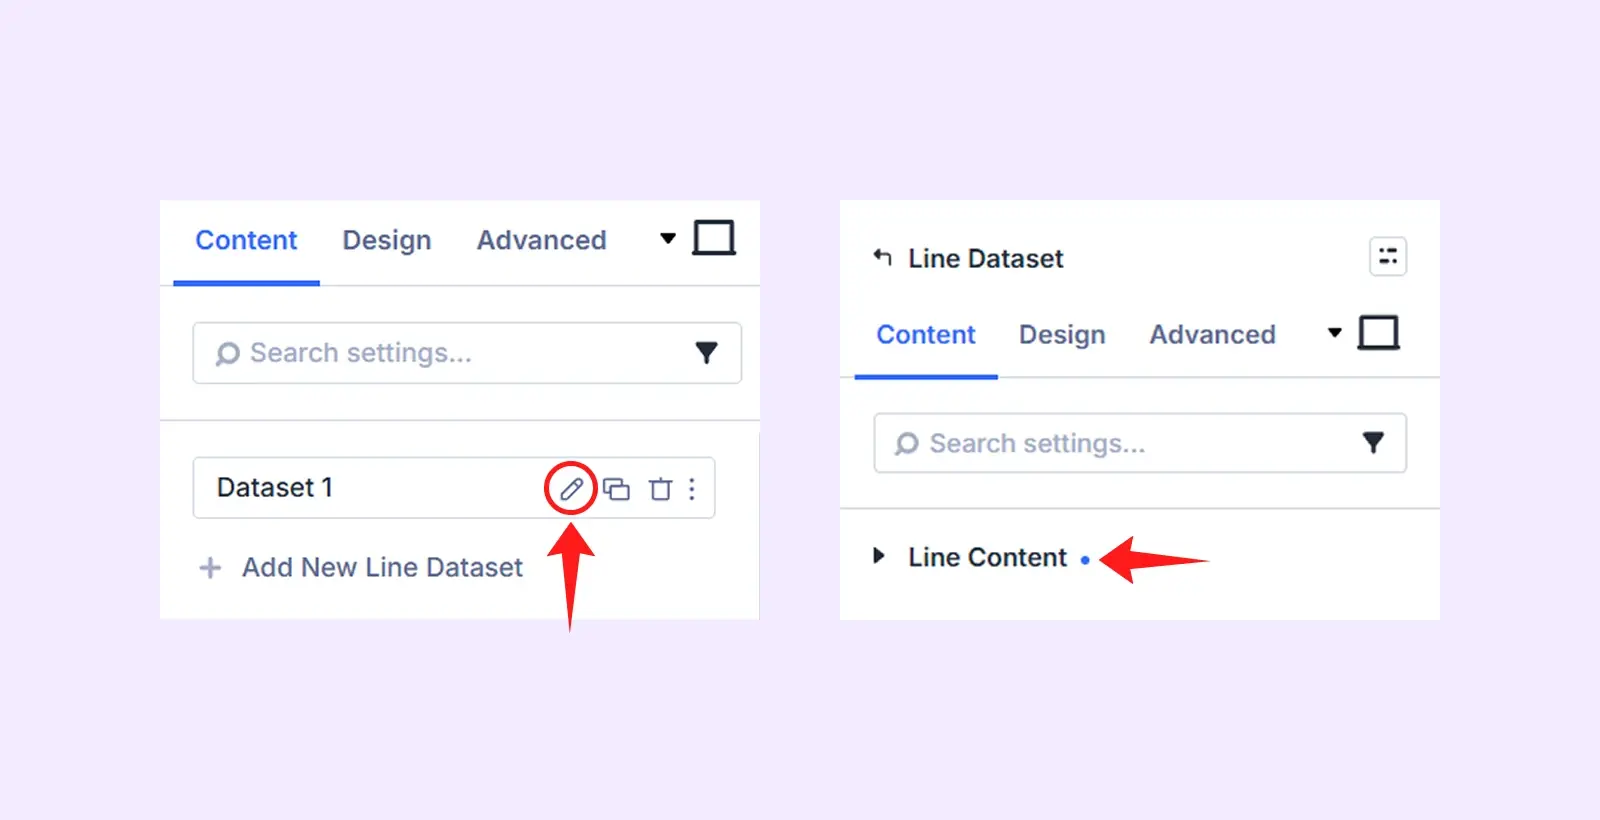
- Next, click the pencil icon on the remaining dataset and open Line Content.
- Delete the default values.
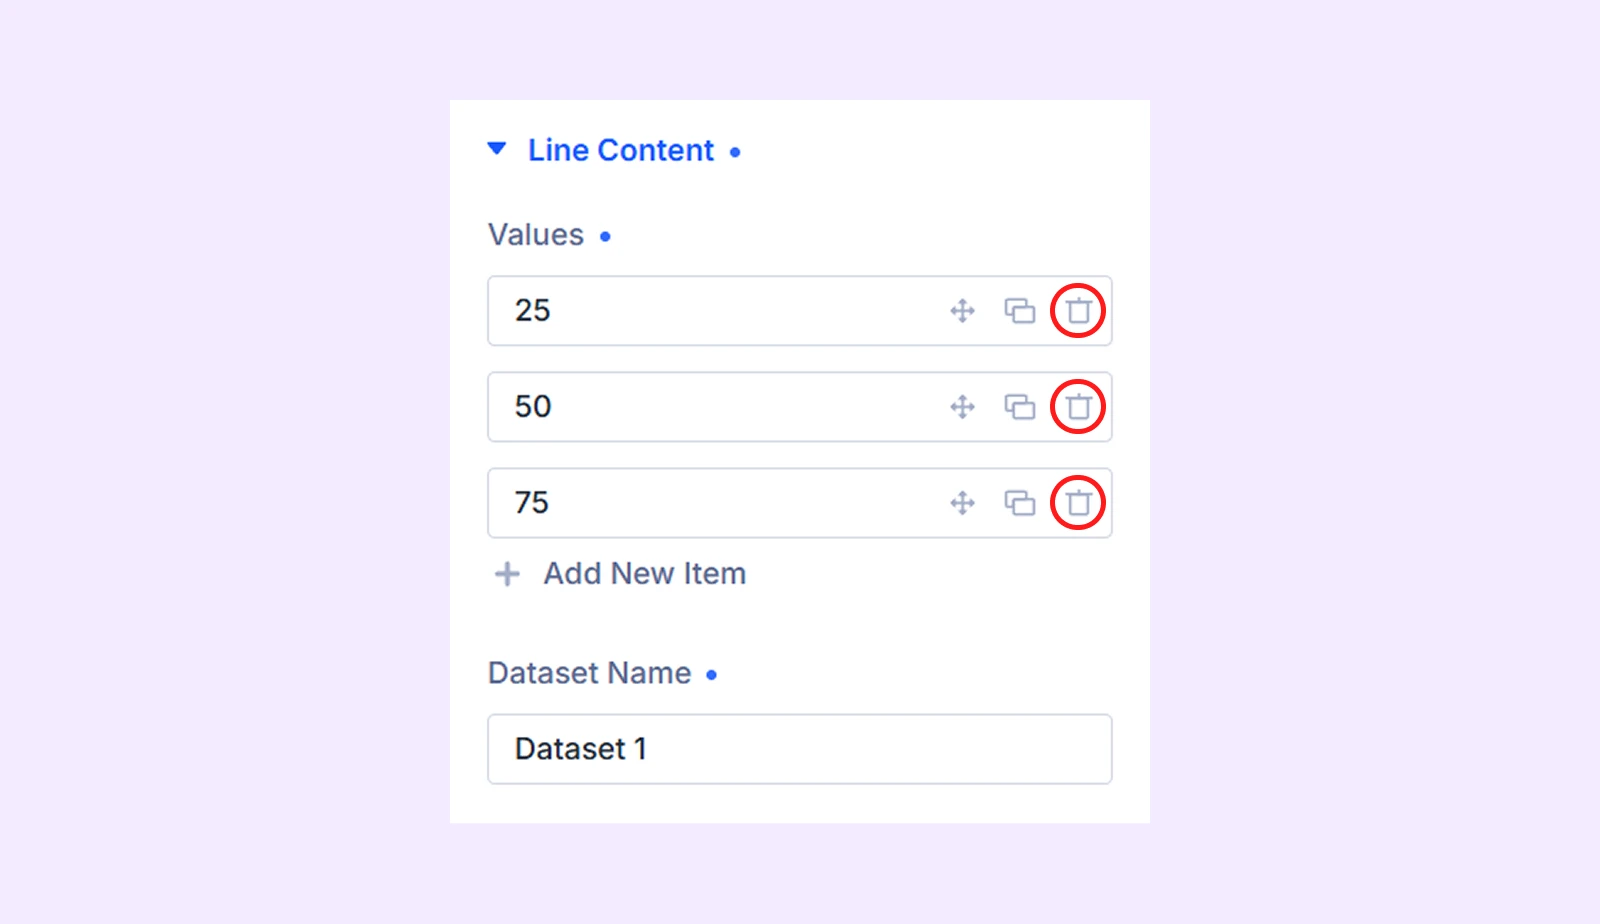
- Click Add New Item and enter 0.4.
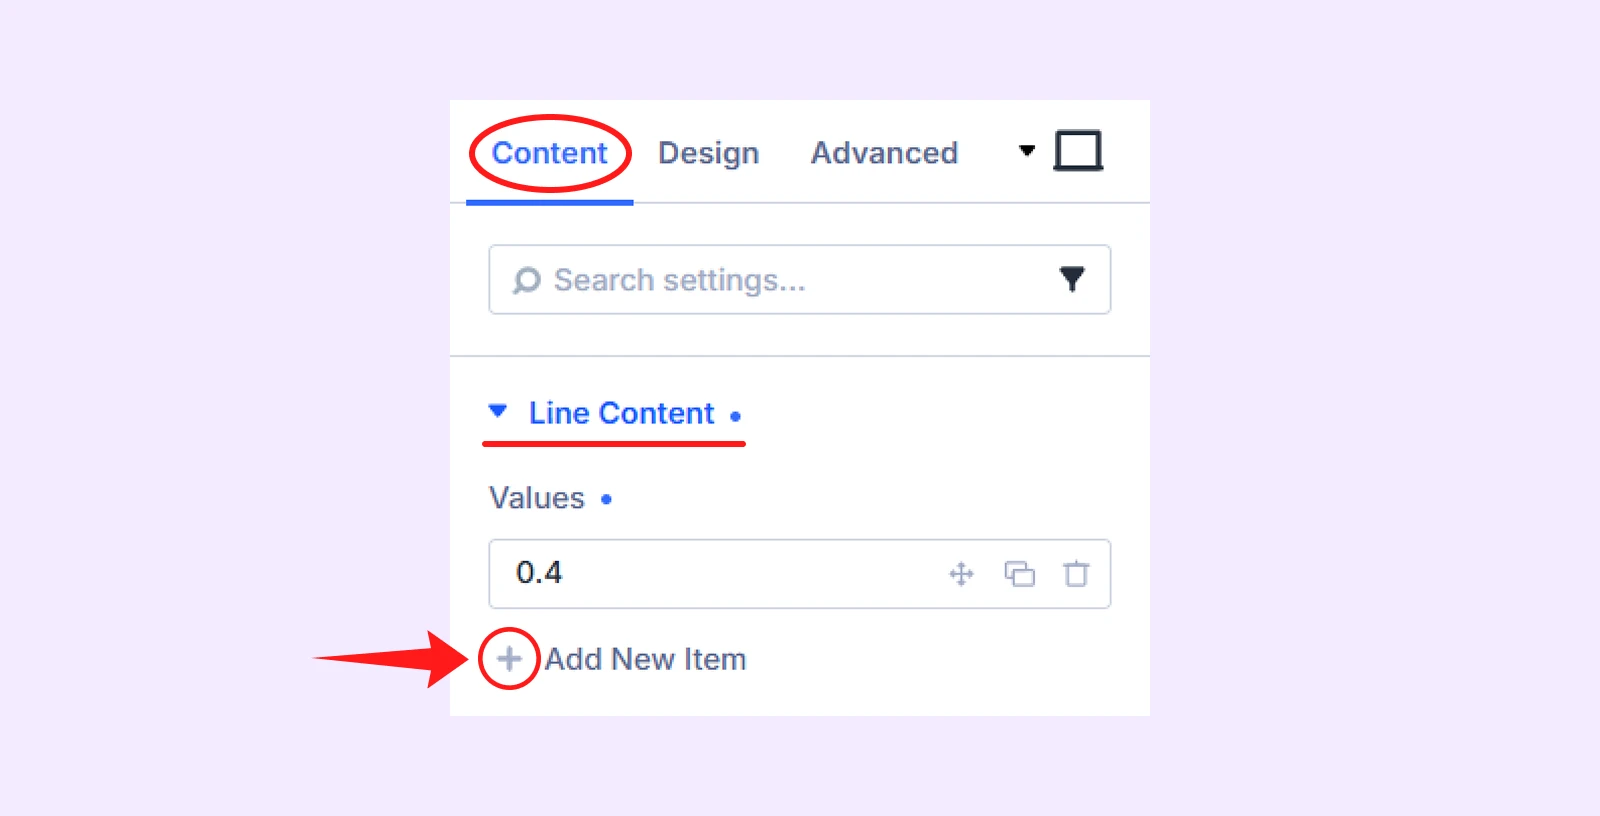
- Add five more items with the following values:
- 0.6
- 0.45
- 0.6
- 0.6
- 0.9
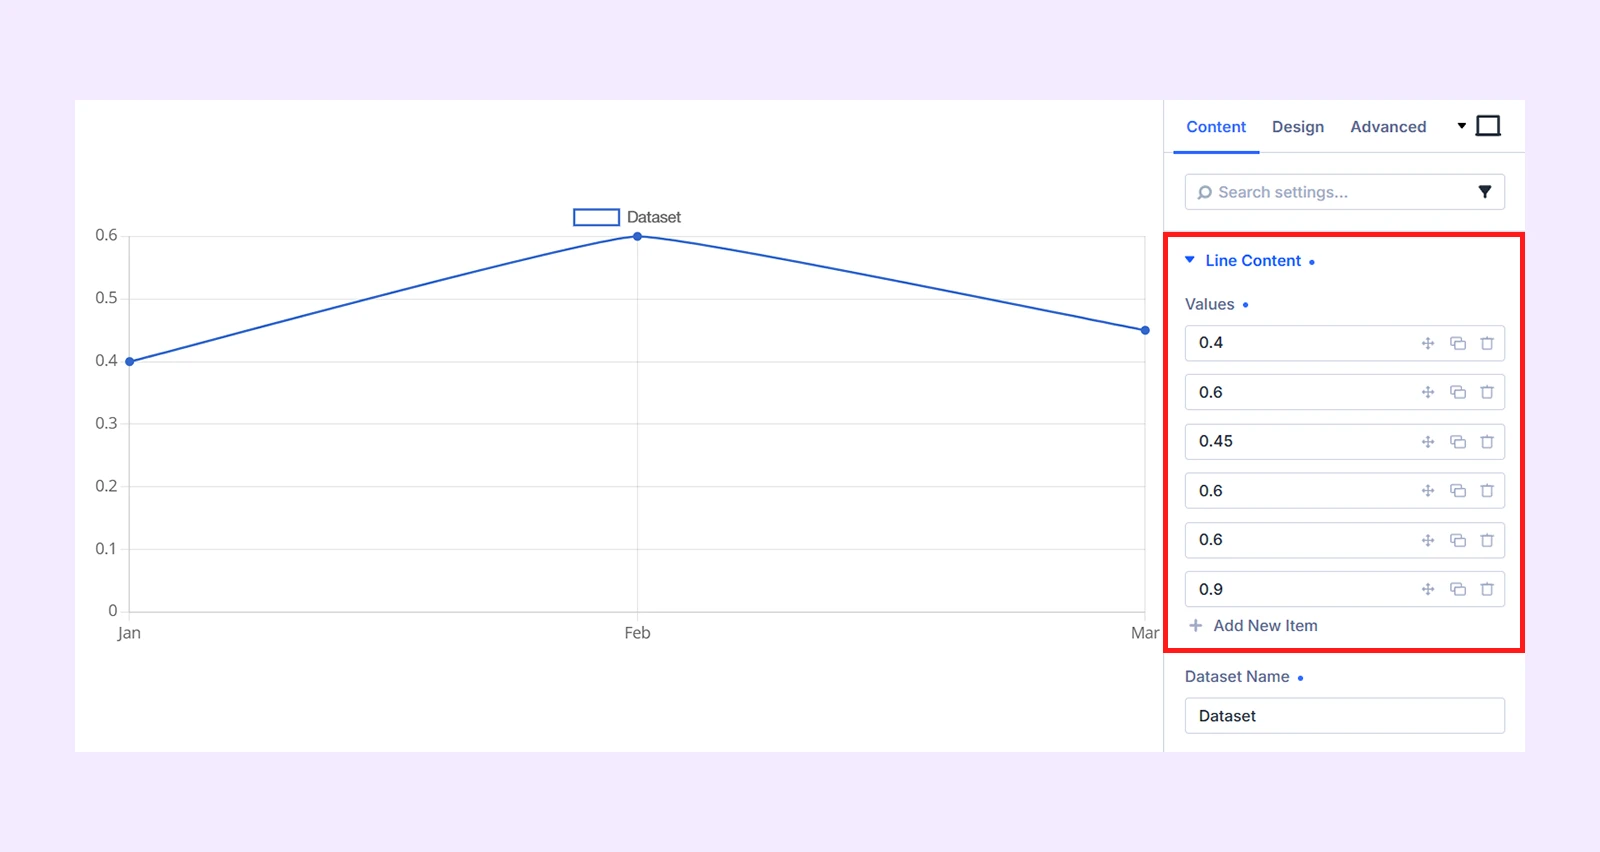
Each value represents a data point on the line.
Step 3: Style Line Dataset
Now click on the Design tab, and make the following changes:
3.1: Customize the Line Style
Open Line Style and configure:
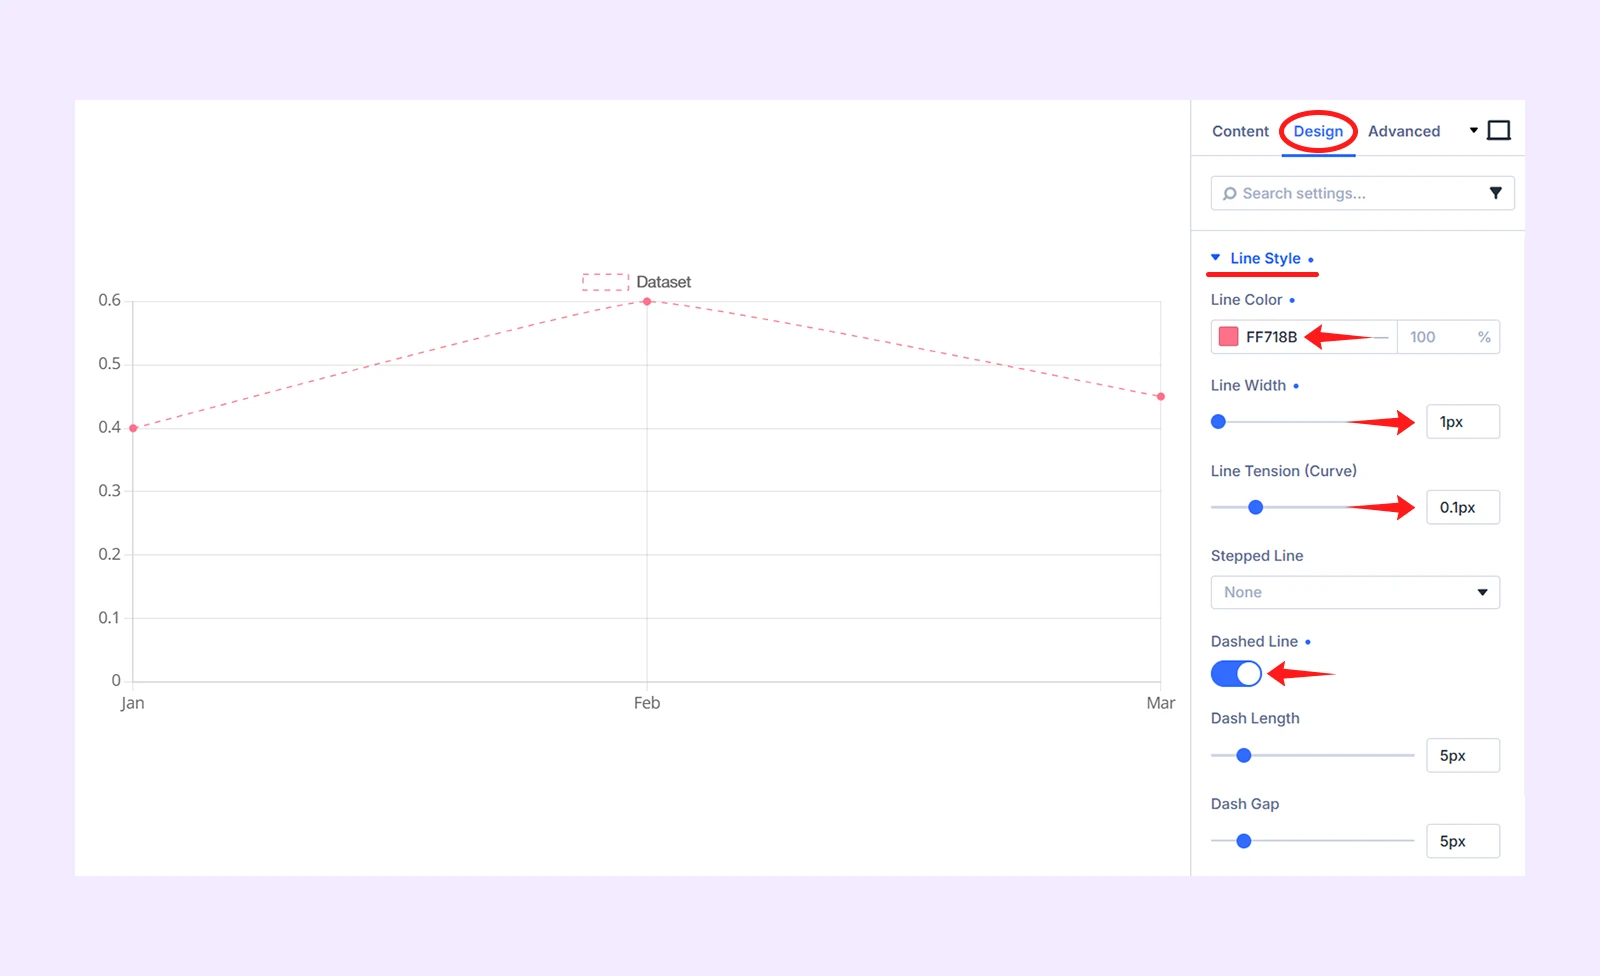
- Line Color: ff718b
- Line Width: 1px
- Dashed Line: Enable it
3.2: Customize the Data Points
Open Point Style and configure:
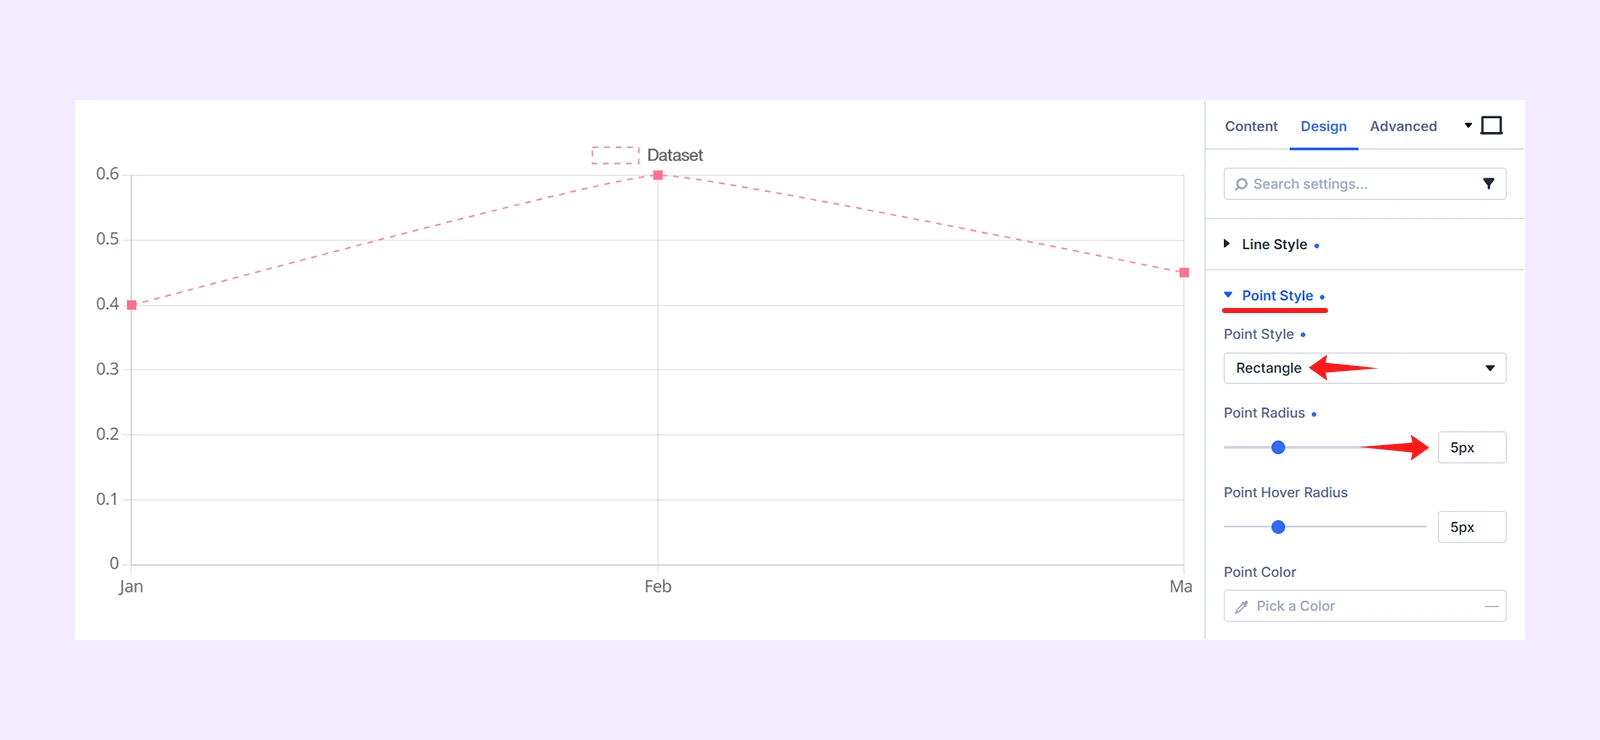
- Point Style: Rectangle
- Point Radius: 5px
Step 4: Configure the Chart Display
After customizing the dataset, configure the chart-level settings from the parent module.
4.1: Add the Chart Labels
Go to Content > General Settings. The module includes three labels by default. Add three more labels so the chart has six labels in total.
Click Add New Item and enter:
- Apr
- May
- Jun
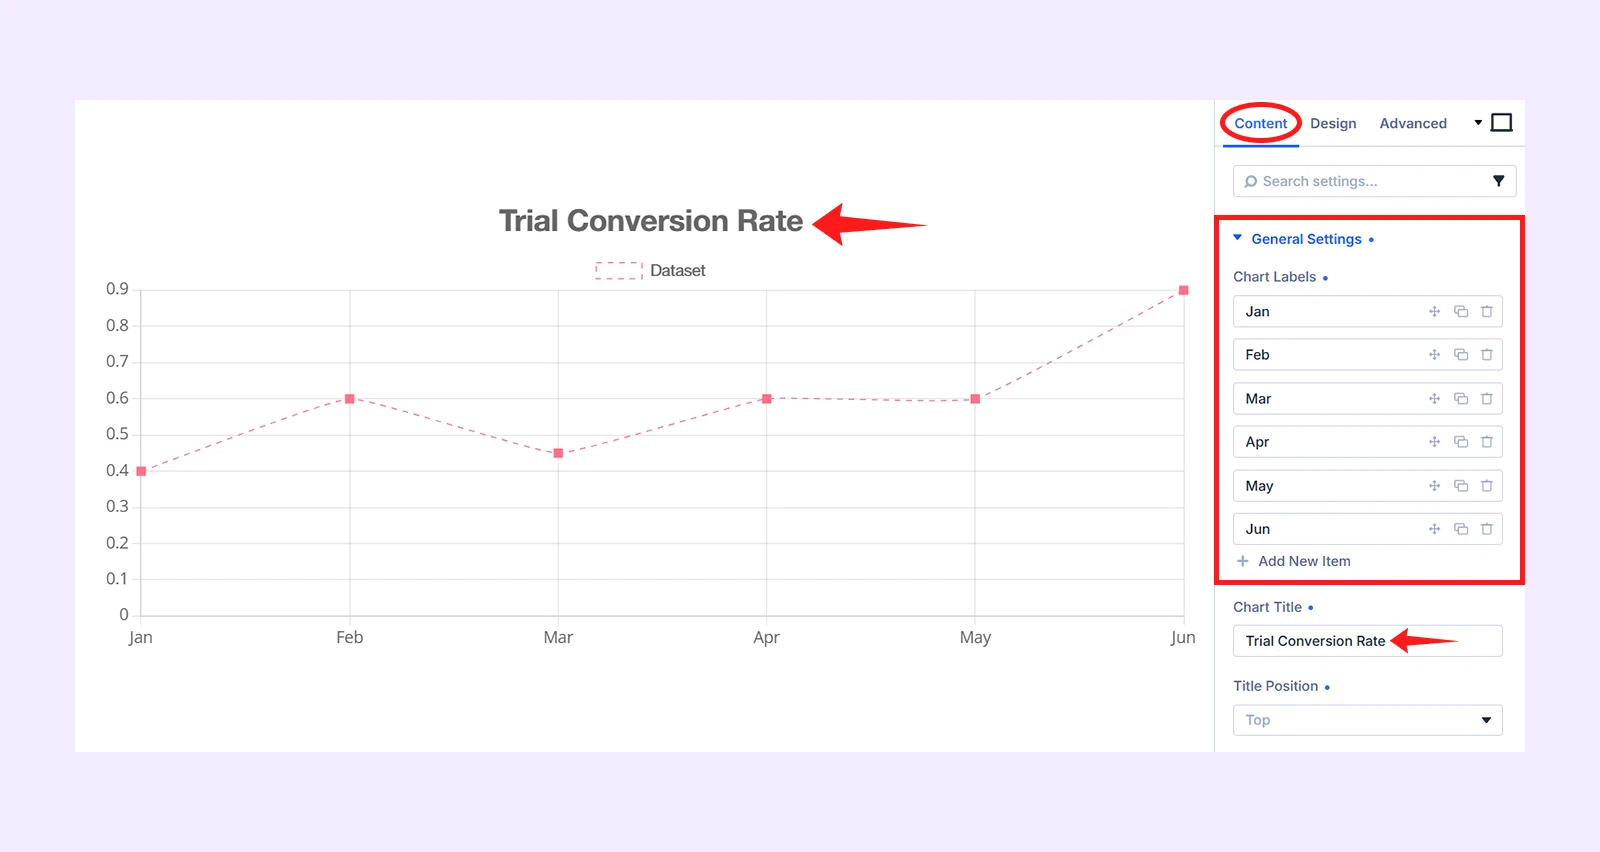
You can also use the Chart Title field to add a heading that explains what the chart represents.
4.2: Adjust the Y-Axis Scale
Go to Content > Y-Axis and configure:
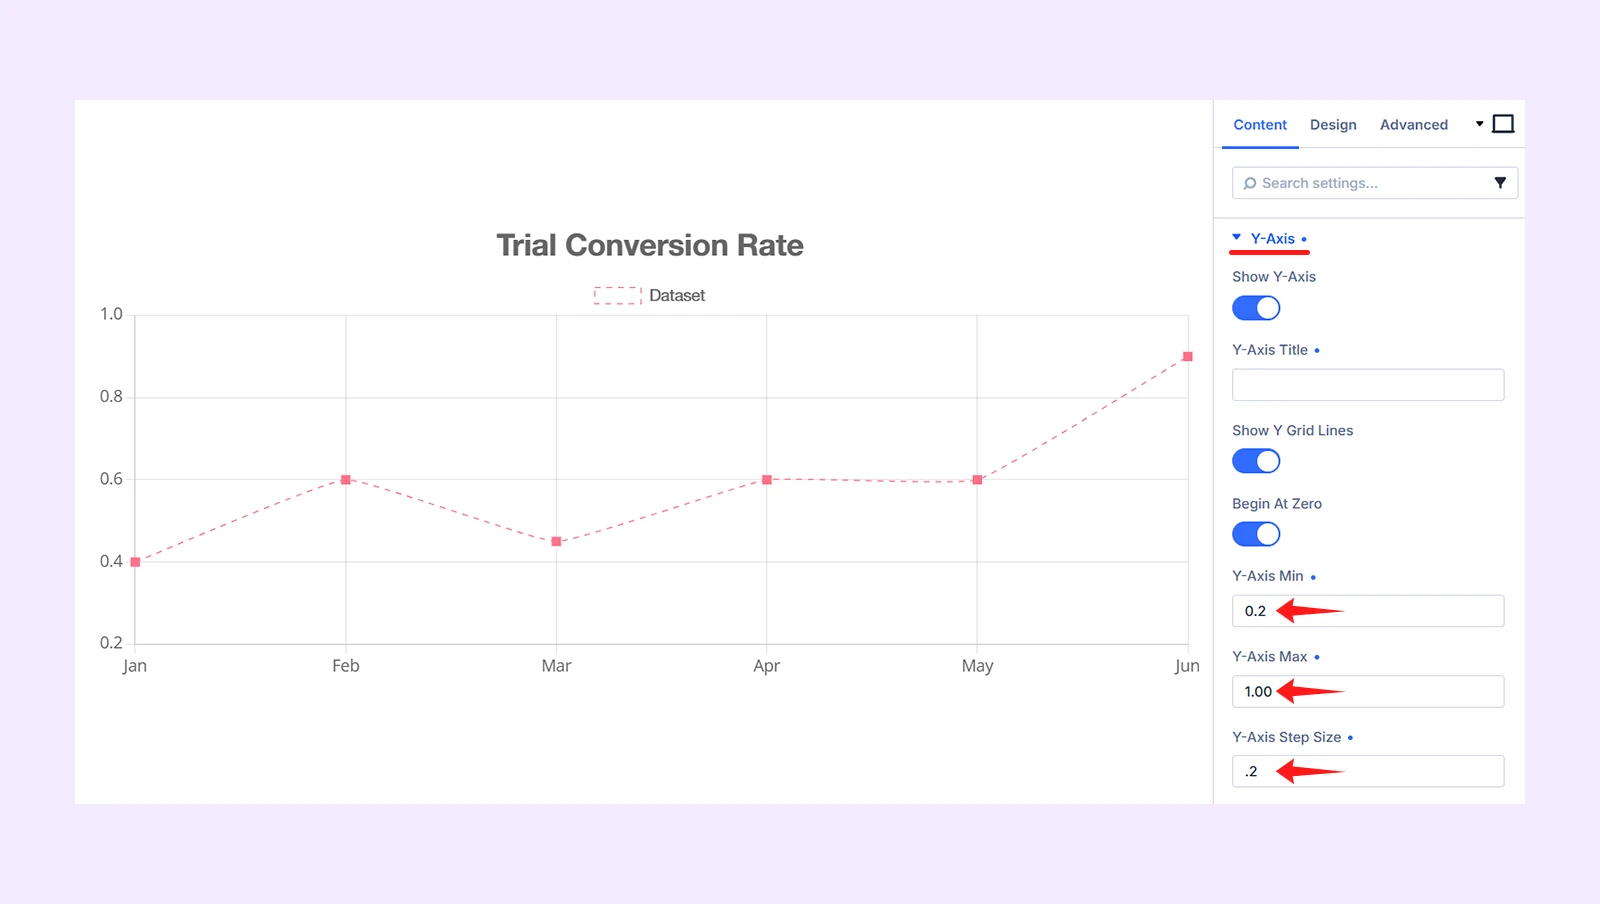
- Y-Axis Min: 0.2
- Y-Axis Max: 1.00
- Y-Axis Step size: .2
These values control the visible range and spacing of the Y-axis.
Step 5: Customize the Entire Line Chart
Navigate to the Design tab and make the following changes.
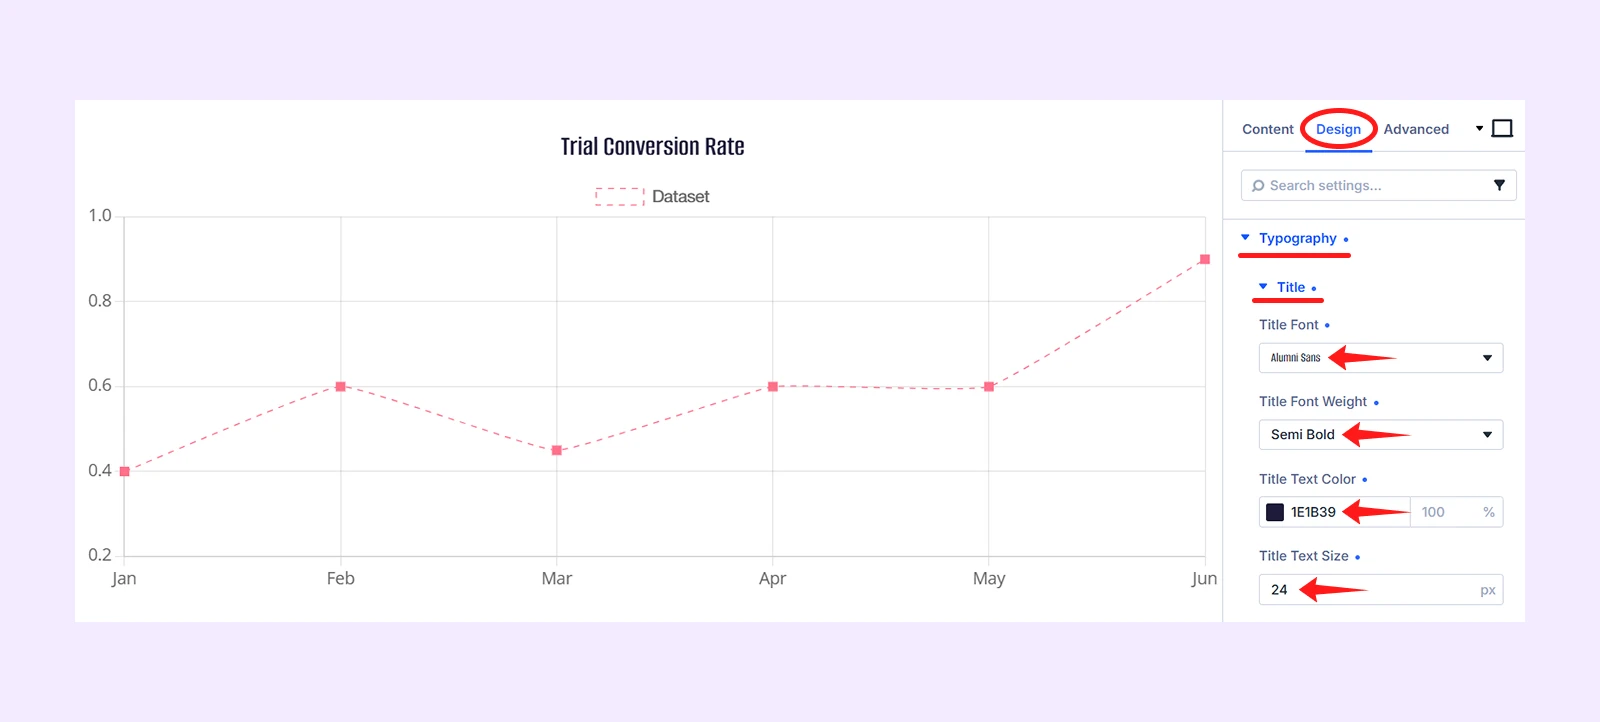
5.1: Adjust the Typography
Open Typography and apply the following settings.
- Title: Title Font (Alumni Sans), title font weight (semi bold), title text color (1e1b39), and title text size (24)
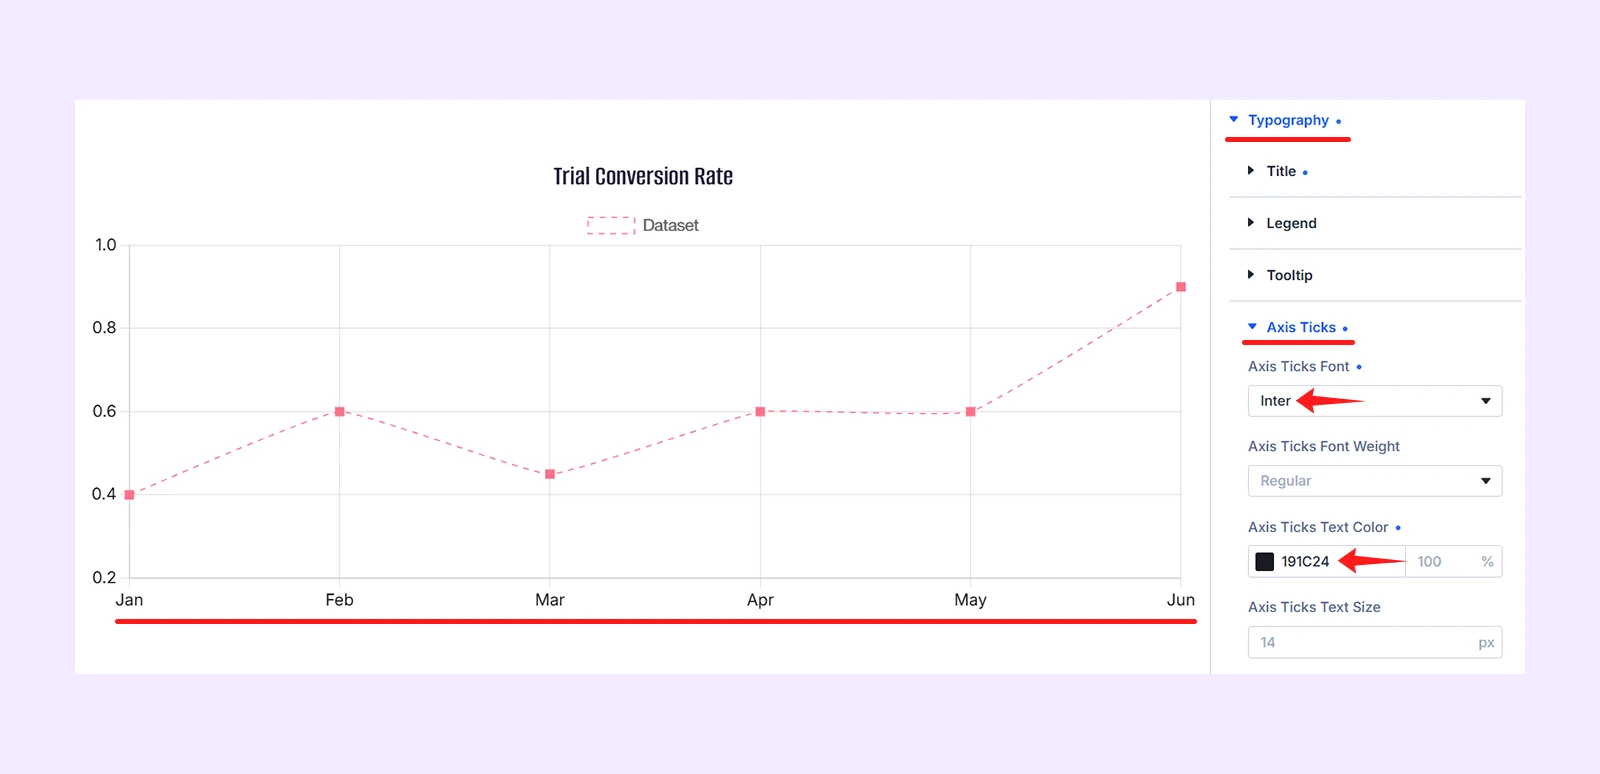
- Axis Tricks: Title Font (Inter), and title text color (191c24)
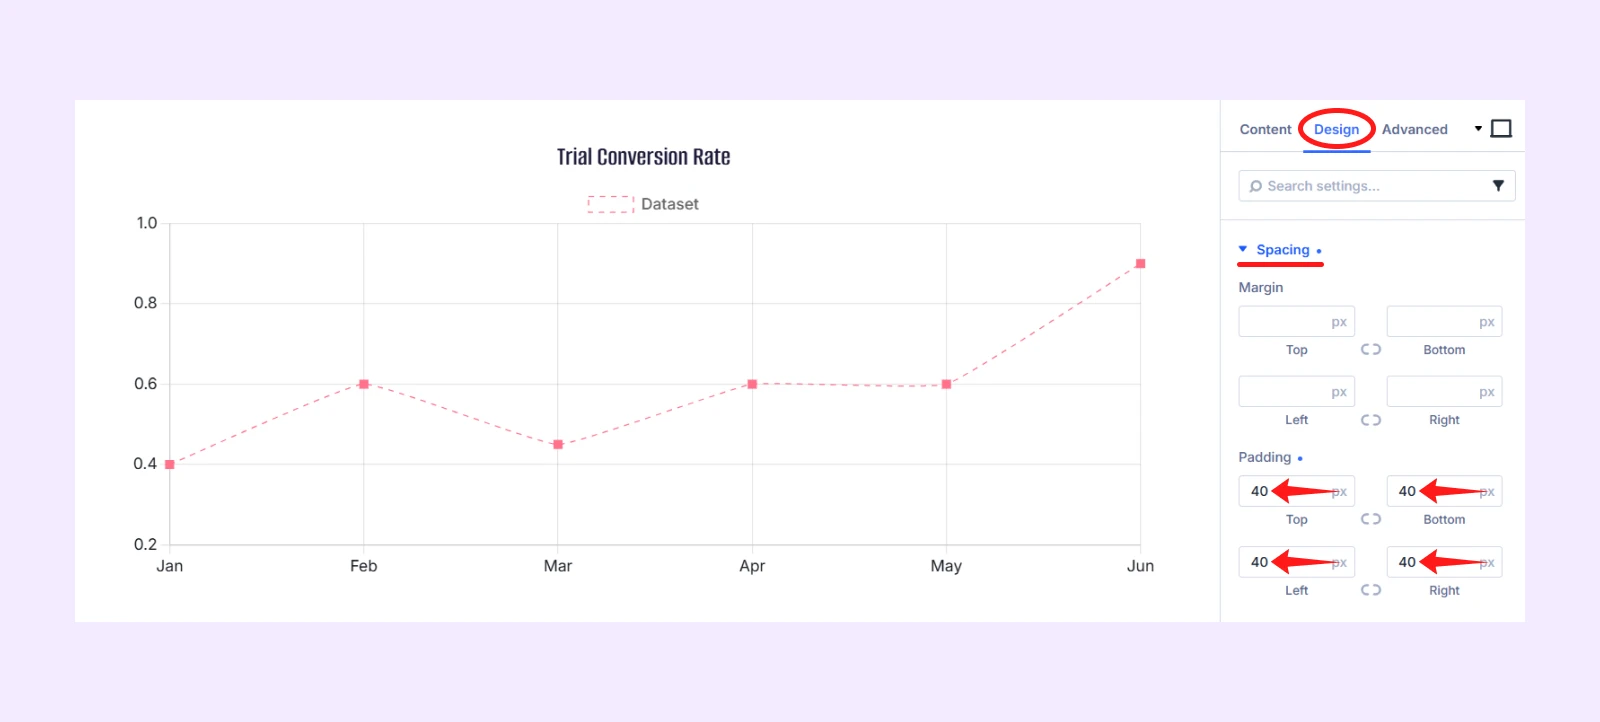
5.2: Adjust the Spacing
Go to Design > Spacing and add:
- Top, bottom, left and right Padding: 40px
Step 6: Save and Publish
Review the dataset values, chart labels, axis scale, colors, and overall appearance. Once everything looks correct:
- Publish the page or save your changes by clicking Update.
- And exit the Visual Builder.
Your line chart will now appear on the live page.
Here is the final output:
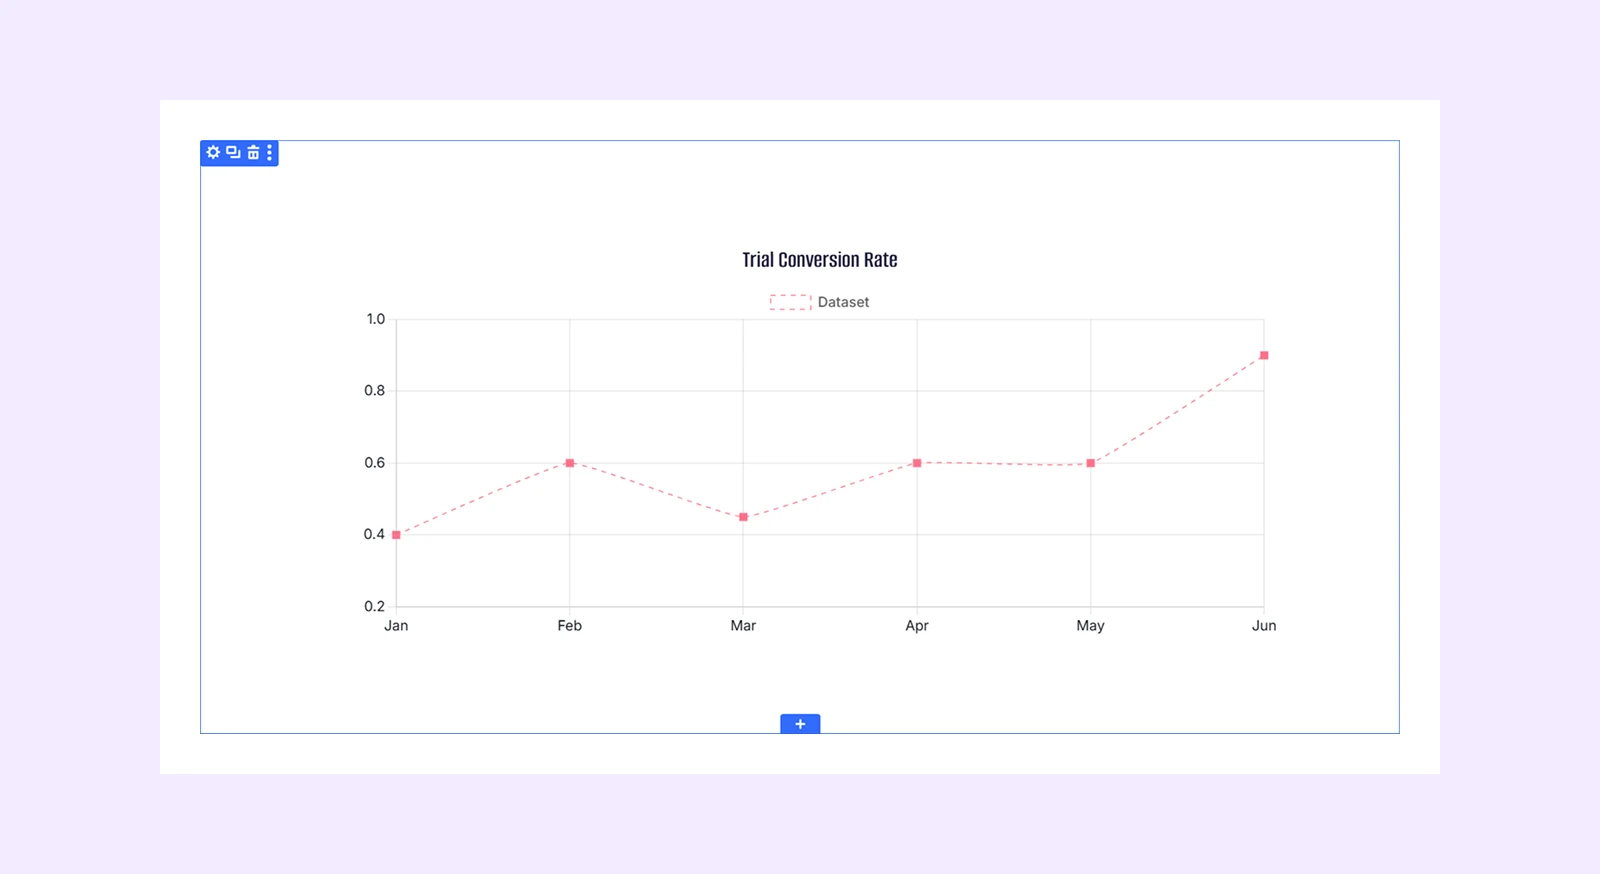
Note: You may see differences in the chart’s size and spacing depending on your selected row structure, column width, and module settings.
Final Thoughts
Now you know how to create a line chart in Divi. We used DiviFlash’s Line Chart module to add the dataset, configure the axes, and customize the chart’s overall appearance.
We recommend using the plugin because Divi does not include a built-in module for creating line charts.
The DiviFlash plugin not only lets you create line charts but also includes modules for creating bar, and pie charts in Divi. That means you can handle multiple chart needs with one plugin.


0 Comments