


Global e-commerce sales are expected to reach approximately $7.4 – $8.1 trillion by the end of 2026. That’s huge as the market grows around 7–8% year over year and it’s expected to surpass $12 trillion by 2030.
It means one thing: e-commerce is no longer just another sales channel; it is becoming the future of retail. And if you are running or planning an online store, understanding the latest market insights can help you identify opportunities and make informed decisions.
To help you with that, we have listed 100+ e-commerce statistics on market size, consumer behavior, mobile commerce, use of Ai, industry trends and more.
Let’s first look at some key stats.
Key E-Commerce Stats
- Global e-commerce sales are expected to reach $7.4 – $8.1 trillion in 2026.
- Online sales are expected to make up 21.1% of all retail sales worldwide in 2026.
- Mobile devices bring in around 78% of e-commerce traffic and 70% of online orders.
- Around 70.22% of online shopping carts are abandoned before checkout.
- 39% of shoppers leave their carts because shipping, taxes, or other extra costs are too high.
- 29% of e-commerce businesses already use AI, while another 48% are testing it.
- Social commerce sales are expected to reach nearly $102 billion in 2026.
- Around 70% of shoppers buy products from international sellers.
We reviewed each statistic using original reports, government data, first-party surveys, and trusted industry sources. We also checked the publication date, research method, sample size, and context behind each number.
Global Ecommerce Statistics
Global retail ecommerce measures the total value of products and services sold online worldwide. The statistics below show the size of the global ecommerce market and how quickly online shopping continues to grow.
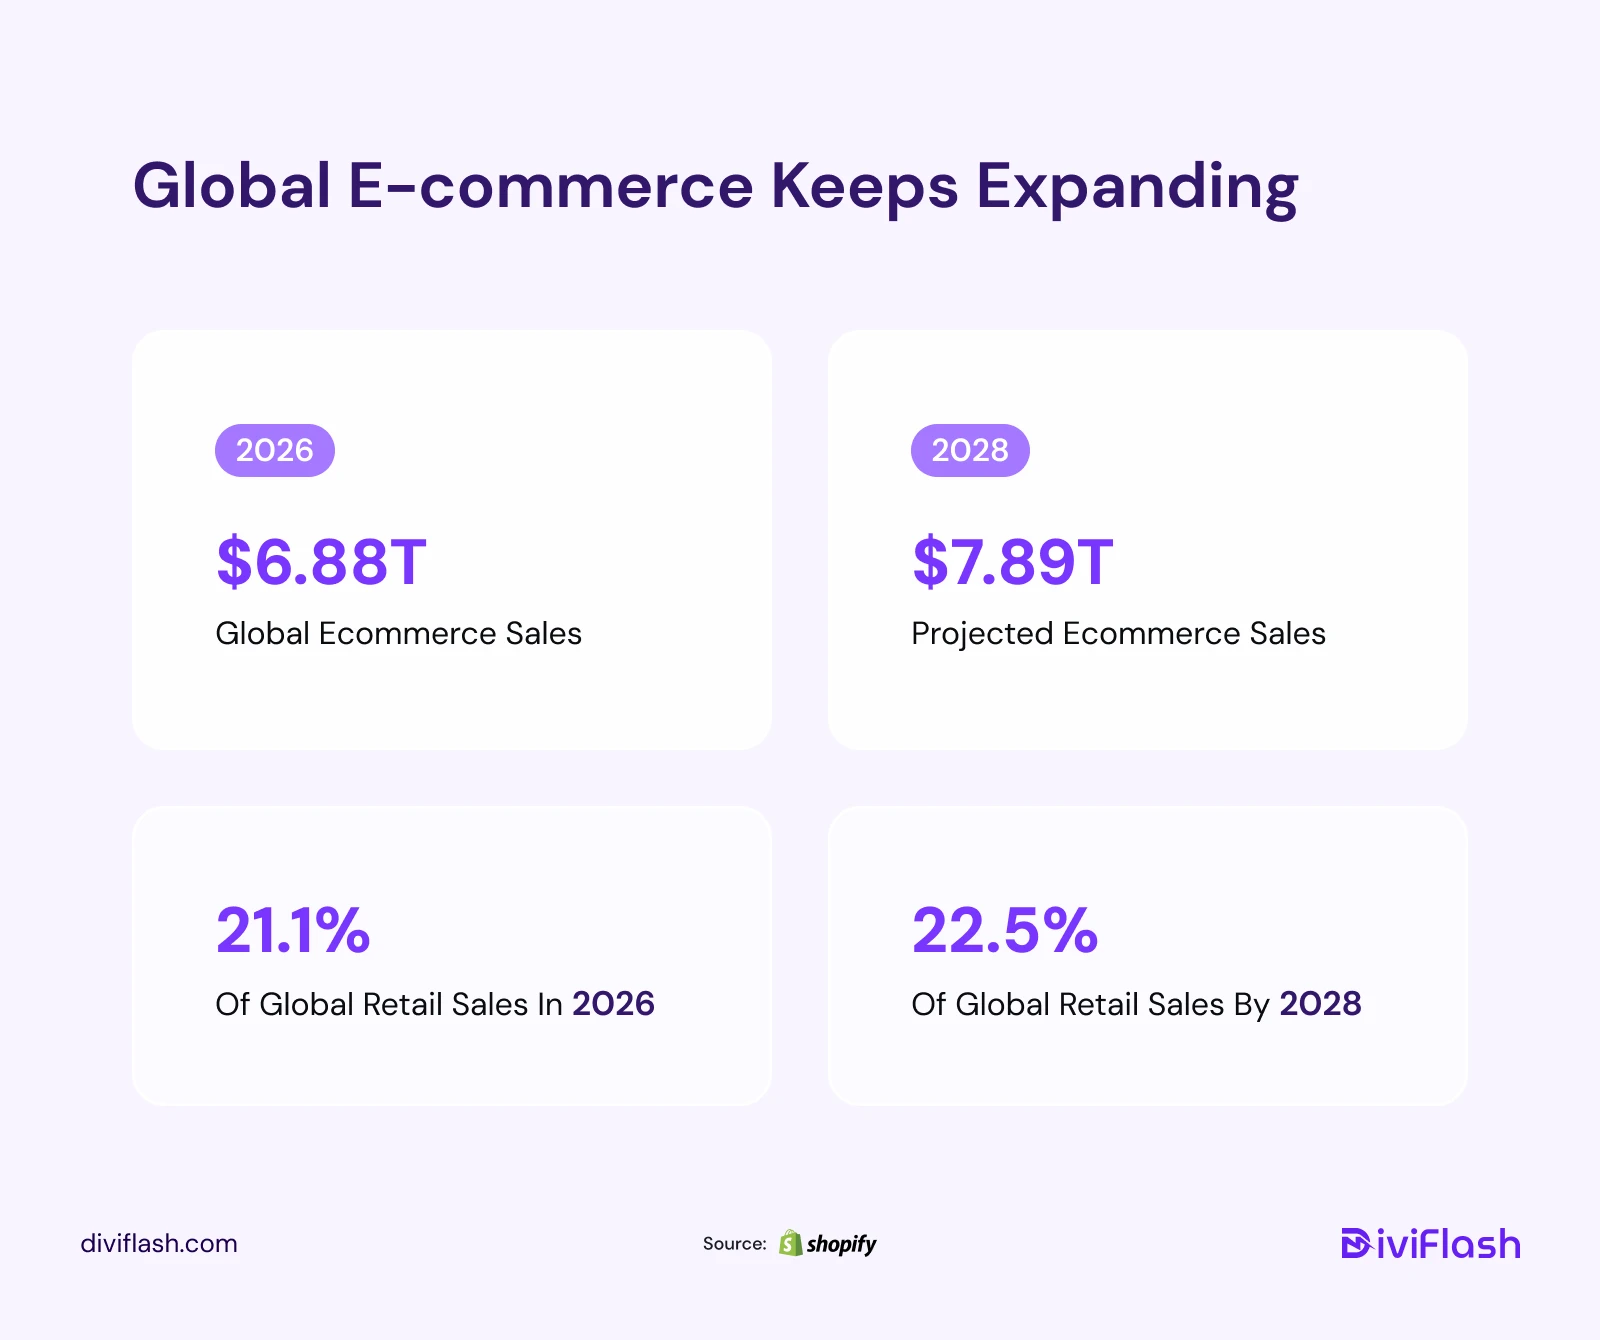
- Global retail ecommerce sales are forecast to reach $6.88 trillion in 2026. (Shopify)
- Worldwide ecommerce sales are expected to grow by 7.2% in 2026. (Shopify)
- Ecommerce is projected to account for 21.1% of total global retail sales in 2026. (Shopify)
- Global ecommerce sales are forecast to reach approximately $7.38 trillion in 2027. (Shopify)
- Worldwide ecommerce sales could reach $7.89 trillion by 2028. (Shopify)
- Ecommerce’s share of worldwide retail sales is expected to reach 22.5% by 2028. (Shopify)
What this means: Online shopping is taking a larger share of global retail every year. Businesses that continue investing in ecommerce are more likely to keep pace with changing consumer behavior and market growth.
Ecommerce Statistics by Country and Region
Ecommerce growth differs across countries and regions. These statistics show where online shopping is growing fastest and which markets lead global sales.
- U.S. retail ecommerce sales reached $326.7 billion in the first quarter of 2026. (U.S. Census Bureau)
- Online sales made up 28.8% of total retail sales in Great Britain in May 2026. (ONS)
- U.S. ecommerce sales increased by 2.7% from Q4 2025 to Q1 2026. (U.S. Census Bureau)
- U.S. ecommerce sales grew by 9.8% year over year in Q1 2026. (U.S. Census Bureau)
- Ecommerce accounted for 16.9% of total U.S. retail sales in Q1 2026. (U.S. Census Bureau)
- Canada recorded C$5.03 billion in retail e-commerce sales in May 2026, up 3.1% year over year. (Statistics Canada)
- Total U.S. retail sales reached an estimated $1.929 trillion in Q1 2026. (U.S. Census Bureau)
- Total U.S. retail sales increased by 3.9% year over year in Q1 2026, compared with ecommerce growth of 9.8%. (U.S. Census Bureau)
- Among EU businesses with web sales, 85.65% sold through their own websites or apps, while 45% used marketplaces. (Eurostat)
B2B Ecommerce Statistics
B2B ecommerce covers online sales between businesses, such as manufacturers, wholesalers, and distributors. The statistics below highlight the size of the B2B market and how businesses are increasingly moving their purchasing online.
- The global B2B ecommerce market was valued at approximately $36 trillion in 2026. (International Trade Administration)
- The worldwide B2B ecommerce market was forecast to grow at a 14.5% compound annual growth rate through 2026. (International Trade Administration)
- Asia-Pacific was expected to represent around 80% of global B2B ecommerce value in 2026. (International Trade Administration)
- More than 90% of B2B companies have shifted at least part of their field-sales activity to phone or video channels since 2020. (International Trade Administration)
- Global B2C ecommerce revenue is forecast to reach $5.5 trillion by 2027. (International Trade Administration)
- EDI-type ecommerce generated 11.07% of total EU enterprise turnover, compared with 8.39% from web sales. (Eurostat)
- Approximately 46.04% of EU manufacturing businesses making e-sales received orders through EDI-type messages. (Eurostat)
What this means: B2B ecommerce is much larger than B2C and continues to grow as businesses buy online. A strong digital sales experience is now essential for long-term growth.
Online Shopping Behavior Statistics
Online shopping habits reveal how people browse, compare, and complete purchases. The statistics below highlight the behaviors that influence conversions, customer loyalty, and overall ecommerce performance.
- More than half of surveyed online shoppers have sold something through an online marketplace. (DHL)
- The average online order contains 4.95 items, meaning shoppers typically buy about five products at a time. (Statista)
- Only one-quarter of surveyed shoppers said they never abandon their online shopping carts. (DHL)
- Free shipping is the leading factor encouraging shoppers to complete an online purchase. (DHL)
- Gen Z, Millennials, and Gen X prefer social media for product discovery. (HubSpot)
- More than one in ten shoppers have at least three delivery or returns subscriptions. (DHL)
- Half of shoppers had recently cancelled a logistics subscription because it cost too much. (DHL)
Mobile Ecommerce Statistics
Mobile ecommerce covers online purchases made on smartphones and tablets. The statistics below show how mobile devices have become the primary way people browse and shop online.
- The global mobile commerce market is projected to reach $2.4 trillion in 2026. (Shopify)
- Mobile commerce is forecast to grow at a 9.5% compound annual growth rate through 2034. (Shopify)
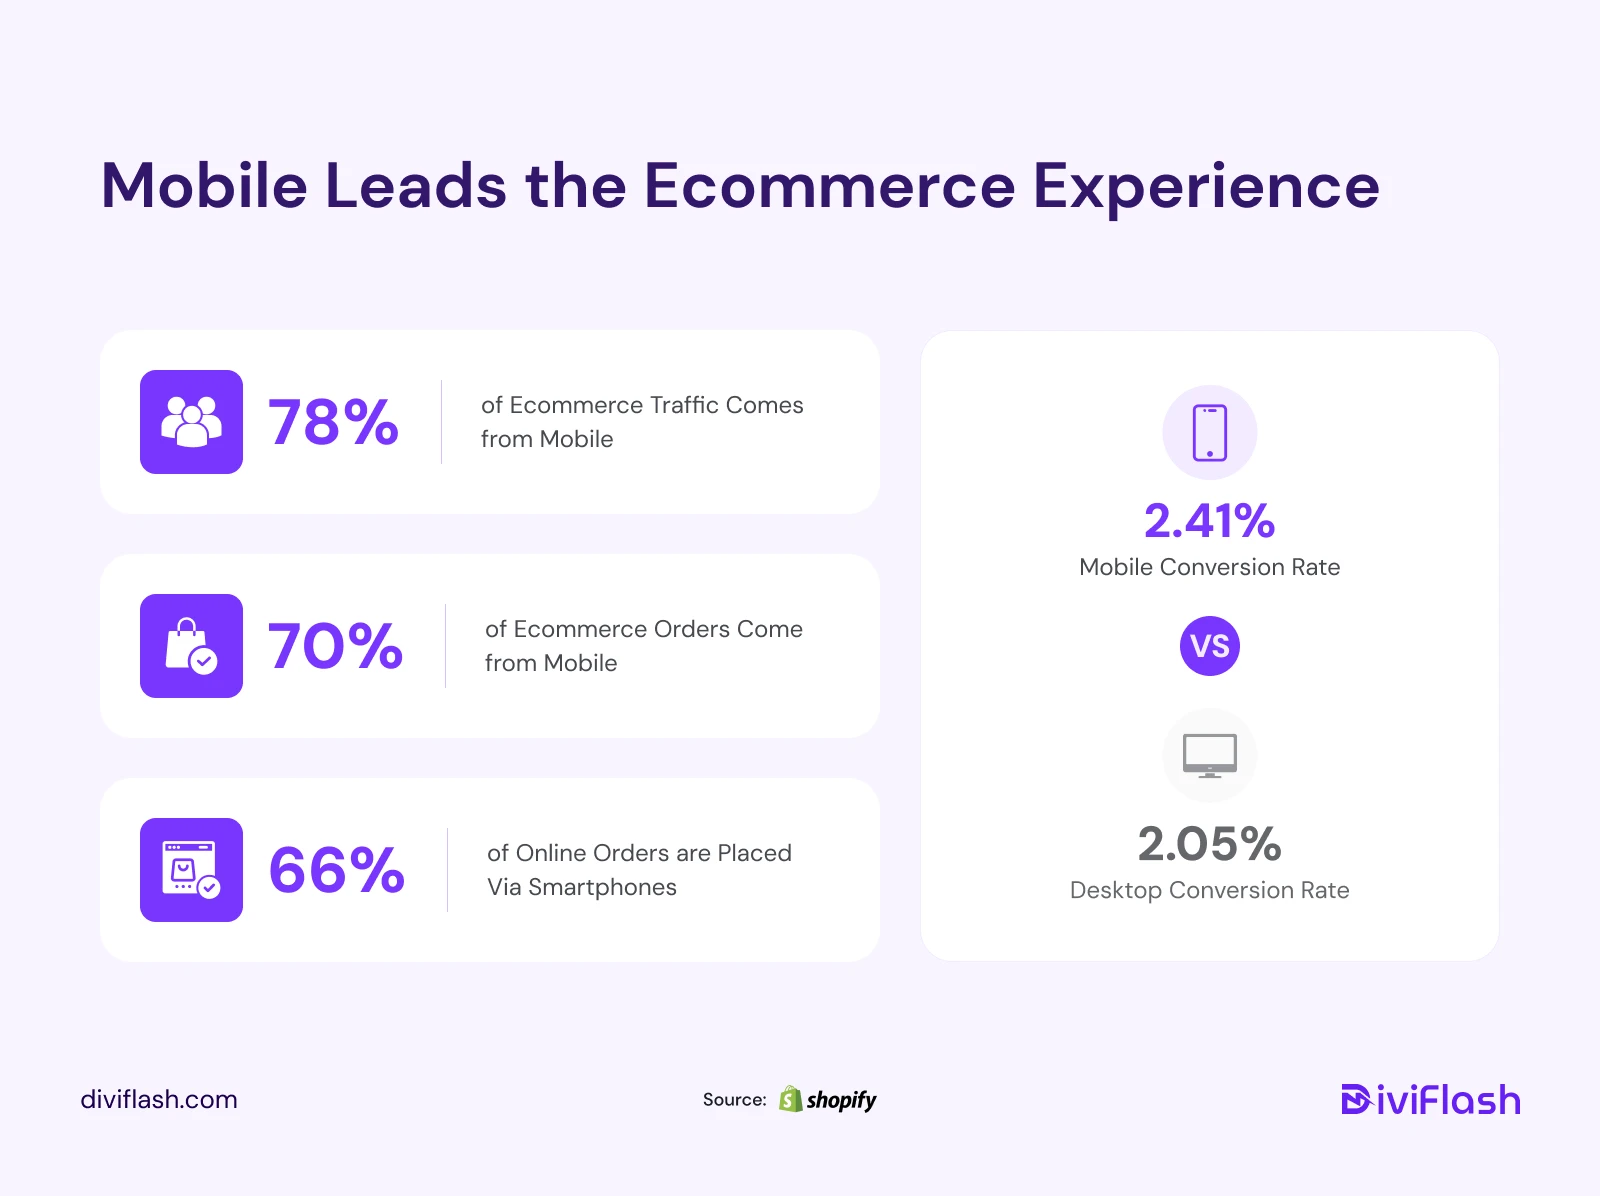
- 66% of online orders are placed via smartphones. (Statista)
- The mobile commerce market could reach $5 trillion by 2034. (Shopify)
- Mobile devices generate approximately 78% of global ecommerce traffic. (Shopify)
- Mobile devices generated 76% of e-commerce website traffic. (Dynamic Yield)
- Mobile devices account for approximately 70% of ecommerce orders. (Shopify)
- The average mobile ecommerce conversion rate reached 2.41% in February 2026. (Shopify)
- The average desktop conversion rate was 2.05% in the same February 2026 benchmark. (Shopify)
- Cart abandonment was 12.03% higher on mobile than on desktop in the same benchmark. (Shopify)
What this means: Mobile is now the most important ecommerce channel. Even small improvements to mobile speed and checkout can have a significant impact on sales.
Social Commerce Statistics
Social commerce lets shoppers discover and buy products directly through social media platforms. These statistics show how social shopping continues to grow and influence online buying.
- The global social commerce market is projected to reach nearly $102 billion in 2026. (Shopify)
- Social commerce is expected to account for 7.6% of total retail ecommerce sales in 2026. (Shopify)
- Retail social commerce sales are forecast to surpass $100 billion for the first time in 2026. (Shopify)
- Social-media creator revenue is forecast to reach $20.6 billion in 2026. (Shopify)
- The number of social commerce users could reach 1.77 billion by 2029. (Shopify)
- One in three shoppers has purchased something following a creator’s recommendation. (Shopify)
- Forty-six percent of shoppers say short-form videos influence their purchasing decisions. (Shopify)
- Sixty-three percent of businesses sell through social channels, while 45% of shoppers purchase through them. (DHL)
Ecommerce Search Statistics
Site search helps shoppers quickly find the products they want. The statistics below show how search affects product discovery, conversions, and the overall shopping experience.
- Fifty-six percent of U.S. shoppers begin online product searches on Amazon. (Algolia)
- Forty-two percent begin their product searches through search engines, while 29% use Walmart. (Algolia)
- Sixty-nine percent of shoppers use site search to find products on retail websites. (Algolia)
- After a successful onsite search, 92% of shoppers purchase the item they searched for. (Algolia)
- Seventy-eight percent purchase at least one additional item following a successful search. (Algolia)
- Approximately 80% of shoppers are more likely to leave and buy elsewhere following an unsuccessful site search. (Algolia)
- Search visitors converted at 4.63%, compared with a sitewide average of 2.77% in one benchmark. (Algolia)
- Only 15% of companies have dedicated resources for optimizing ecommerce site search. (Algolia)
- Only 7% of companies report using site-search data to improve other areas of their businesses. (Algolia)
What this means: Site search delivers much higher conversion rates than the average shopping session, but only a small share of companies actively invest in improving it.
Ecommerce Conversion Rate Statistics
Conversion metrics show how effectively ecommerce websites turn visitors into customers. The statistics below highlight recent trends in conversions, order values, revenue, and sales growth.
- The average ecommerce conversion rate was 2.03% in June 2026 in IRP Commerce’s benchmark. (IRP Commerce)
- The benchmark conversion rate increased from 1.85% in June 2025 to 2.03% in June 2026. (IRP Commerce)
- The ecommerce conversion rate increased by approximately 9.74% year over year. (IRP Commerce)
- Average ecommerce order value reached £127.06 in June 2026. (IRP Commerce)
- Average order value increased by 2.31% year over year. (IRP Commerce)
- Average ecommerce revenue per session reached £1.89 in June 2026. (IRP Commerce)
- Revenue per session increased by approximately 28.48% year over year. (IRP Commerce)
- Ecommerce sales in the IRP benchmark increased by 13.48% year over year in June 2026. (IRP Commerce)
What this means: Rising conversion rates and order values indicate that many ecommerce businesses are becoming more efficient at turning traffic into sales and revenue.
Shopping Cart Abandonment Statistics
Shopping cart abandonment occurs when shoppers add products to their cart but leave without completing the purchase. The statistics below show how common it is and what factors contribute to lost sales.
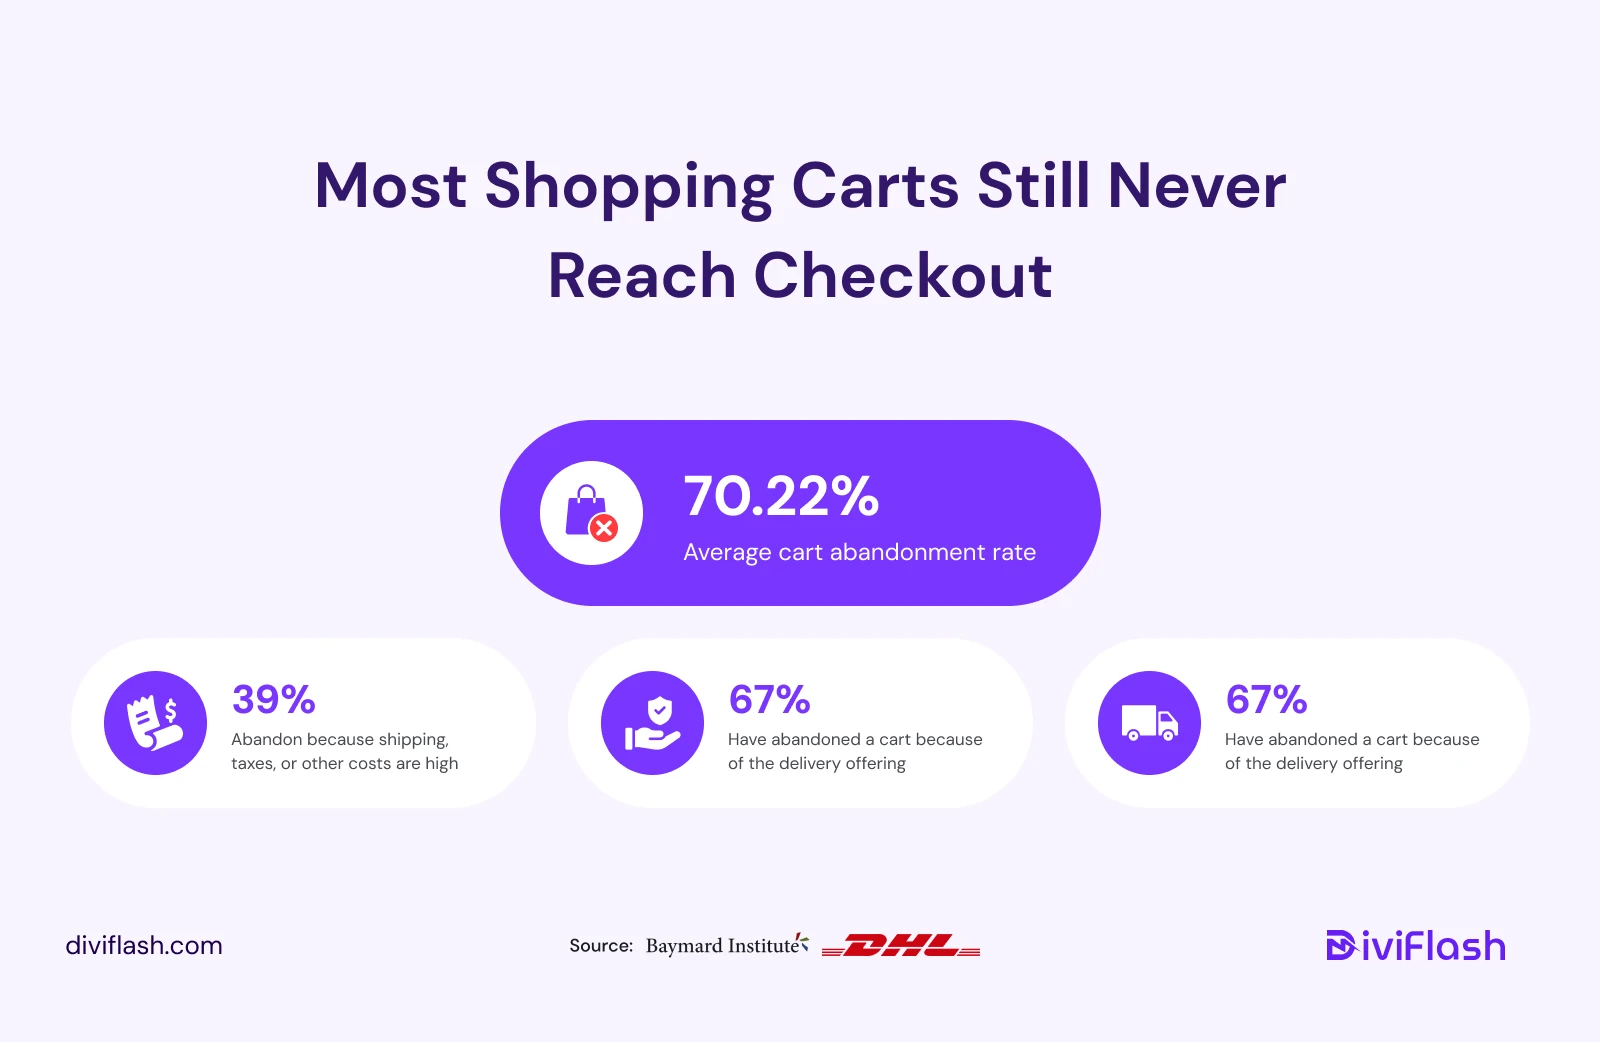
- The average documented online cart abandonment rate is 70.22%. (Baymard Institute)
- Baymard calculated its average from 50 separate cart-abandonment studies. (Baymard Institute)
- Forty-three percent of U.S. shoppers abandon carts because they are browsing or are not ready to buy. (Baymard Institute)
- Thirty-nine percent abandon because shipping, taxes, or other additional costs are too high. (Baymard Institute)
- Twenty-one percent abandon because delivery is too slow. (Baymard Institute)
- Nineteen percent abandon because they do not trust the website with their card information. (Baymard Institute)
- Nineteen percent abandon because the website requires them to create an account. (Baymard Institute)
- Eighteen percent abandon because the checkout process is too long or complicated. (Baymard Institute)
- Fifteen percent abandon because the return policy is unsatisfactory. (Baymard Institute)
- Fifteen percent abandon because the website crashes or displays errors. (Baymard Institute)
- Ten percent abandon because the website does not offer enough payment methods. (Baymard Institute)
What this means: Most shoppers abandon their carts because of unexpected costs or a complicated checkout. Clear pricing, guest checkout, and a faster checkout process can recover more sales without major website changes.
Ecommerce Payment Statistics
- Worldpay’s payment research covered more than 63,000 consumers across 42 markets. (Worldpay)
- Online shoppers use an average of four payment methods. (DHL)
- Ecommerce businesses offer an average of seven payment methods. (DHL)
- Buy now, pay later generated $20 billion during the 2025 U.S. holiday season. (Adobe Analytics)
- Holiday BNPL spending grew by 9.8% year over year. (Adobe Analytics)
- Smartphones generated 82.2% of BNPL purchases during the 2025 holiday season. (Adobe Analytics)
- BNPL purchases surpassed $1.03 billion on Cyber Monday 2025. (Adobe Analytics)
Ecommerce Platform Statistics
- Approximately 83.1% of websites do not use an ecommerce system monitored by W3Techs. (W3Techs)
- WooCommerce is used by 8.2% of all websites measured by W3Techs. (W3Techs)
- WooCommerce holds 48.5% of the detected ecommerce-system market. (W3Techs)
- Shopify is used by 5.3% of all websites measured by W3Techs. (W3Techs)
- Shopify holds 31.2% of the detected ecommerce-system market. (W3Techs)
- PrestaShop holds approximately 2.9% of the detected ecommerce-system market. (W3Techs)
- OpenCart holds approximately 2% of the detected ecommerce-system market. (W3Techs)
- Adobe Commerce holds approximately 1.5% of the detected ecommerce-system market. (W3Techs)
- EU companies generated more than five times as much web-sales turnover through their own websites and apps as through marketplaces. (Eurostat)
Ecommerce Shipping and Delivery Statistics
- Sixty-seven percent of shoppers have abandoned a cart because of the delivery offering. (DHL)
- Fifty-two percent of ecommerce businesses identify delivery as a reason customers abandon purchases. (DHL)
- Seven in ten shoppers avoid retailers when they do not trust the delivery or returns provider. (DHL)
- Seven in ten shoppers abandon carts when their preferred delivery or return options are unavailable. (DHL)
- Nine in ten ecommerce businesses say their delivery and returns offering is important for securing sales. (DHL)
- Almost three in ten shoppers have orders delivered directly to out-of-home locations. (DHL)
- More than six in ten ecommerce returns take place through out-of-home locations. (DHL)
AI in Ecommerce Statistics
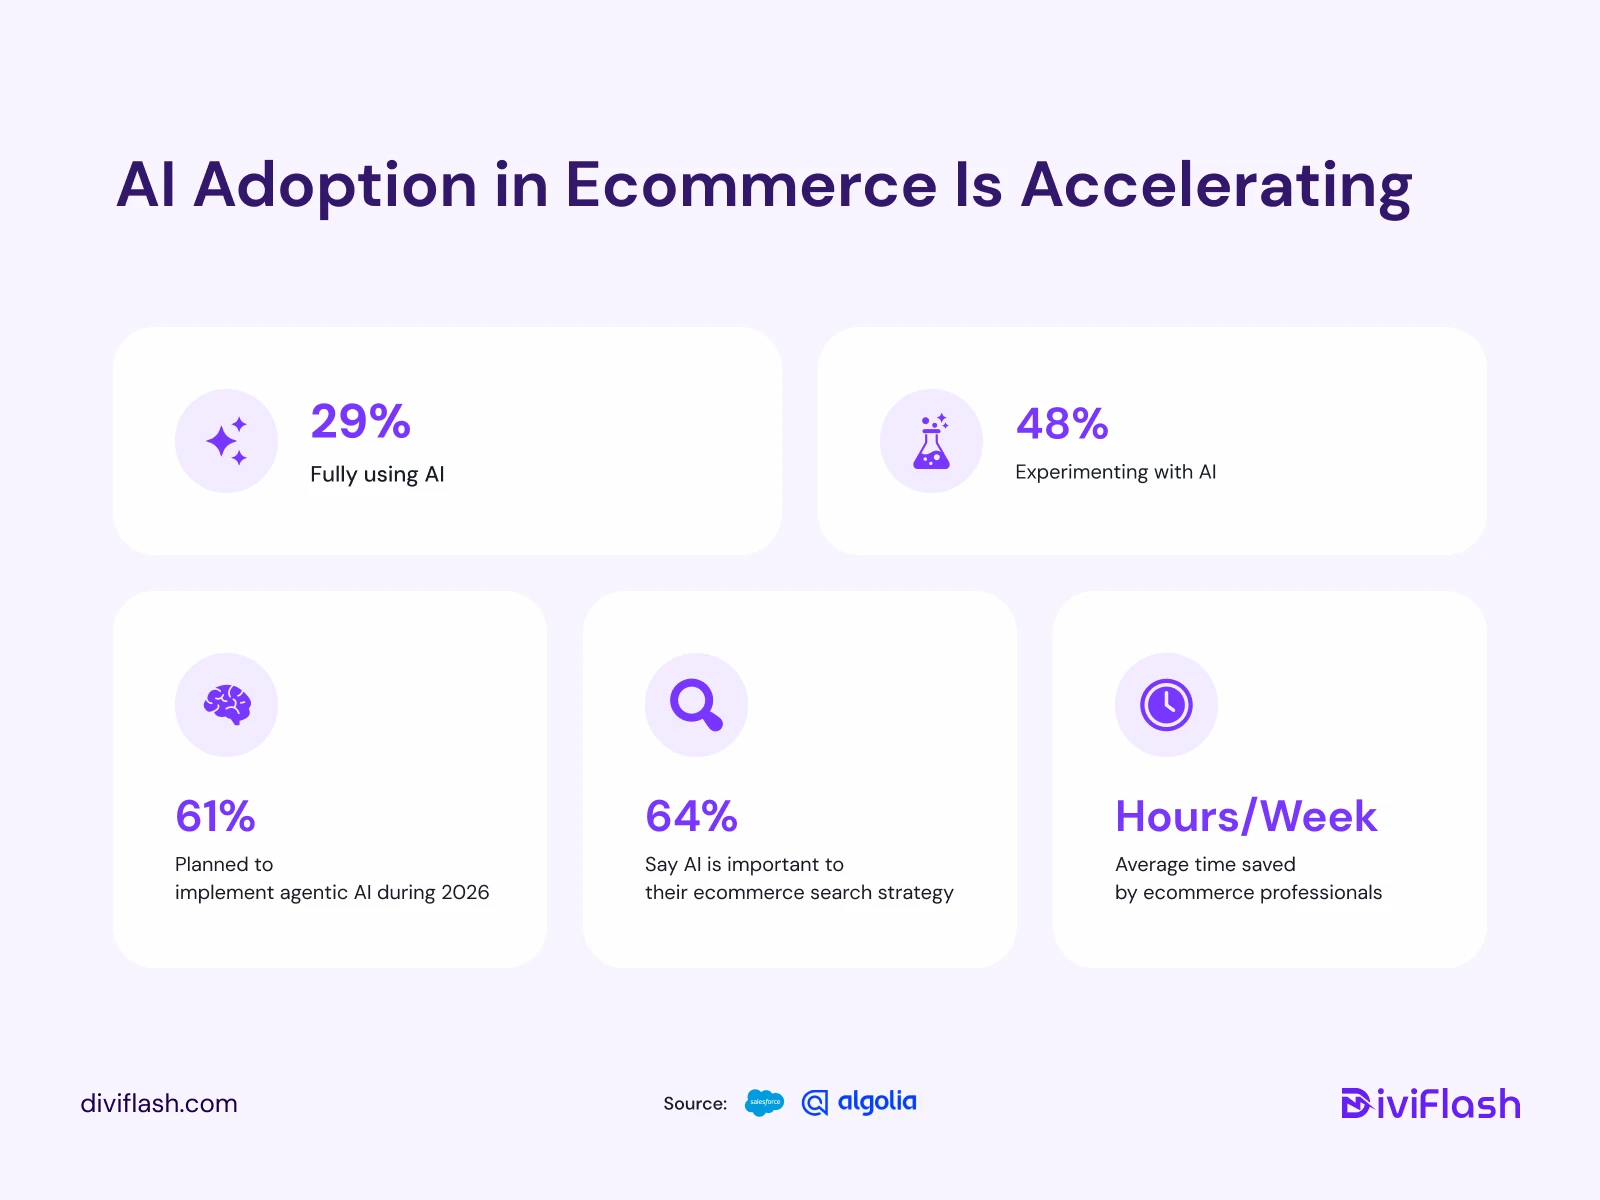
- AI saves ecommerce professionals an average of 6.4 hours per week. (Salesforce)
- Twenty-nine percent of ecommerce organizations are fully using AI. (Salesforce)
- Another 48% of ecommerce organizations are beginning to experiment with AI. (Salesforce)
- Sixty-one percent of surveyed businesses planned to implement agentic AI during 2026. (Algolia)
- Sixty-four percent of surveyed businesses consider AI important to their ecommerce-search strategy. (Algolia)
- Fifty-one percent associate generative AI with better product comparisons. (Algolia)
- Forty-six percent associate generative AI with improved buyer guides. (Algolia)
- Fifty-two percent plan to implement AI tools for their merchandising teams. (Algolia)
- Generative AI referral traffic to U.S. retail websites increased by 693.4% during the 2025 holiday season. (Adobe Analytics)
- AI referral traffic increased by 670% on Cyber Monday 2025. (Adobe Analytics)
- Thirty-eight percent of shoppers use AI-powered chat or virtual assistants when buying online. (DHL)
- Thirty-six percent of ecommerce businesses use AI-powered chat or virtual assistants to sell. (DHL)
What this means: AI is becoming a growing source of ecommerce traffic. Optimizing product pages with clear content and structured data can help AI search tools and shopping assistants recommend your products more often.
Cross-Border Ecommerce Statistics
- Seventy percent of surveyed shoppers purchase from international retailers. (DHL)
- Cross-border shopping increased from 60% in 2025 to 70% in 2026. (DHL)
- Forty-five percent of shoppers purchase internationally more than once per month. (DHL)
- More than three in ten ecommerce orders are shipped internationally. (DHL)
- Twenty-five percent of non-exporting businesses plan to prioritize cross-border delivery within 12 months. (DHL)
- Fifty-one percent of Baby Boomers are concerned about fraud when purchasing internationally. (DHL)
- Sixty-nine percent of Baby Boomers still purchase internationally to access lower prices. (DHL)
- International orders generated 42.8% of sales in IRP Commerce’s June 2026 benchmark. (IRP Commerce)
Ecommerce Fraud Statistics
- Ecommerce fraud losses could reach $131 billion by 2030. (Juniper Research)
- The value of ecommerce fraud is forecast to increase by 133% between 2025 and 2030. (Juniper Research)
- Nineteen percent of shoppers abandon checkout because they do not trust the site with their card information. (Baymard Institute)
Sustainable Ecommerce Statistics
- Thirty-five percent of shoppers have abandoned a purchase because a retailer lacked suitable sustainability credentials. (DHL)
- Thirty-two percent of businesses report customers abandoning purchases because of insufficient sustainability credentials. (DHL)
- Thirty percent of shoppers want green logistics to become standard within five years. (DHL)
- Forty-two percent of ecommerce businesses expect green logistics to become standard. (DHL)
- Fifty-eight percent of shoppers would participate in a recycling or buy-back program if returns were free and easy. (DHL)
Holiday Ecommerce Statistics
- U.S. consumers spent $257.8 billion online during the 2025 holiday season. (Adobe Analytics)
- Holiday ecommerce spending increased by 6.8% year over year. (Adobe Analytics)
- Consumers spent more than $4 billion online on 25 individual days during the holiday season. (Adobe Analytics)
- Cyber Week generated $44.2 billion in online spending. (Adobe Analytics)
- Cyber Monday generated a record $14.25 billion in online spending. (Adobe Analytics)
- Black Friday generated $11.8 billion in online spending. (Adobe Analytics)
- Electronics, apparel, and furniture generated 54% of total holiday ecommerce spending. (Adobe Analytics)
- Social media generated 4.6% of holiday ecommerce revenue, up 40.3% year over year. (Adobe Analytics)
- Affiliate and partner channels generated 20.4% of holiday ecommerce revenue. (Adobe Analytics)
- Ecommerce returns decreased by 1.2% during the 2025 holiday season. (Adobe Analytics)
- One in seven holiday returns occurred between December 26 and December 31. (Adobe Analytics)
FAQ
How big is the global e-commerce market in 2026?
Global retail e-commerce sales are projected to reach $6.88 trillion in 2026, growing 7.2% year over year.
What percentage of global retail sales comes from e-commerce?
E-commerce is expected to account for 21.1% of total global retail sales in 2026.
Is e-commerce still growing in 2026?
Yes. Global e-commerce sales are forecast to grow by 7.2% in 2026 and continue rising through 2028.
How many people shop online worldwide?
More than 3 billion people worldwide were expected to make an online purchase in 2025, the latest figure included in this report.
What percentage of e-commerce traffic comes from mobile devices?
Mobile devices generate approximately 78% of global e-commerce traffic and account for around 70% of orders.
What is the average shopping cart abandonment rate?
The average online shopping cart abandonment rate is 70.22%, based on 50 separate studies analyzed by Baymard Institute.
Final Thoughts
E-commerce is growing every year, and customer expectations are growing with it. People want shopping to be fast, easy, secure, and available on any device.
The statistics in this guide show what is changing, from mobile shopping and AI to social commerce, payment methods, and delivery trends. They also reveal the challenges many online stores still face, such as cart abandonment.
By keeping up with these changes and focusing on what customers want, you can make smarter decisions, improve your store, and grow your business in 2026 and beyond.
FURTHER READING:


0 Comments